
Forecast is an analytics consultancy focused on helping our clients make better data-driven commercial decisions. Established in Edinburgh in 2010 the company has an enviable customer list with some of the UK’s top corporates such as RBS, Lloyds, Sky TV and Sainsbury’s Bank. Forecast entered the Australian market in 2016 and now includes offices in Sydney and Melbourne with clients across the country.
As a consultancy and data solutions provider consisting of commercially-minded data experts, Forecast has always focused on optimising performance by providing insight and clarity.
We started out as a specialist developer of best practice financial models, but over time – by listening closely to our clients’ needs – we expanded our offerings to include Advanced Analytics, Data Infrastructure and Storytelling with Data. We keep moving forward as we become a leading international data solutions provider.
We are proud of all our achievements, but it’s our people we value most. For more than a decade our team has built a reputation for delivering insightful commercial decision tools and solutions.
Whoever we’re working for, and however we can help, we take pride in going the extra mile.
Focus Areas
Forecast Data Services Ltd Clients & Portfolios

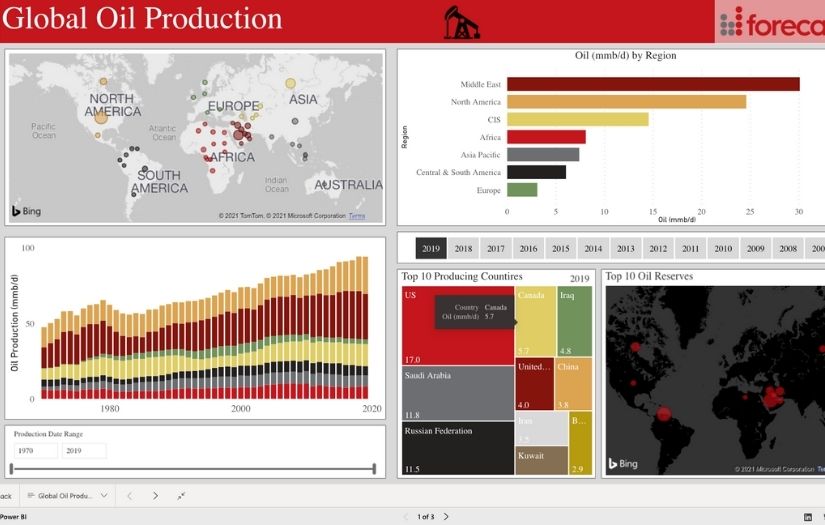
Explore how the global oil & gas production landscape has changed over time and which countries dominate the world markets today. View and compare country production and reserves for both oil & gas over the past 40 years, and easily drill down into each region to see a breakdown by country. The dashboard highlights the top 10 largest producing nations for each year, and the interactive map provides enhanced navigation and data visualisation. These dashboards can be easily updated each year as new data is collated and published. This dashboard uses data from the Statistical Review of World Energy 2020.
https://forecast.global/dashboard/global-oil-gas-production-dashboard/


Client
Our client is a new national retail bank with a full range of banking products and services, including credit cards, savings and loans, mortgages, travel money, and insurance.They are a modern banking organisation utilising today’s technology to deliver premium service and products to their customers.
Purpose
Our client required a pricing and profitability model to allow them to assess the expected financial returns of new credit card offers, given the performance of prior propositions:
- Customer Behaviour Modelling that included a curve creation template to allow users to forecast curves based on limited historical data,
- Identify key points along the customer journey, such as the end of promotional periods, and create linear steps between these points,
- Allow users to visually create a non-linear curve with smaller linear steps. As a new bank being able to forecast from limited actuals was critical to the success of the model,
- Live data connection to tables using SAS queries to give historic proposition data for credit card key drivers, such as interest yield, retail spend and payment rate,
- Provide a dashboard for the end users of the tool to collect key assumptions, allowing the marketing team to draw inferences from their assumptions in one dedicated marketing worksheet.
Approach
The development of the tool was clearly split between the creation and maintenance of the curves, the logic for development of the credit cards, and the development of the marketing user interface. To assess the effectiveness of the customer behaviour forecasts using the curve development tool there was periodic testing of the curves by comparing campaign behaviours to updated actuals and making adjustments to forecasts as necessary.
Outcome
The credit cards pricing and profitability model became a critical tool for a relatively new credit card provider. As a combination of powerful behavioural forecasting and a marketing front-end, the model became a one-stop shop for credits cards forecasting, blending sophistication and user-friendliness.
The model became a central point of focus between finance, analytics and the credit cards team, around which a process was built to manage monthly workflow. This provided focus and efficiency improvements above and beyond the power of the tool itself.


Client
Our client is a provider of subscription television, internet and mobile services. They have an international reach totalling over 22 million customers, and a history of developing innovative products and entertainment content.
Purpose
The client required a campaign effectiveness tool to assess the benefits of varying product offer combinations across different routes to market. The key requirements were to;
- Leverage existing customer data to base the forecast of future behaviour, informing customer decay curves and product attachment rates,
- Capture all associated costs and revenues associated with the forecasted customer movements,
- Combine the resulting cash flows over time and condense into NPV, IRR and payback period KPIs,
- Translation of forecasted results into a P&L view,
- Provide the ability to compare and contrast the impacts of differing campaigns.
Approach
Working closely with the finance team we were able to capture a comprehensive picture of associated costs and revenue for varying routes to market and product holdings. Using SQL to query data from internal databases we compiled a rich dataset, which allowed us to apply the appropriate customer behaviours based on offer depth/duration and route to market. A campaign capture element allowed quick and easy negotiation and comparison between different offer sets and their resulting KPIs, both at customer and estate P&L level.
Outcome
Completion of the tool allowed the finance team to appraise and optimise their campaign line-up, having confidence that the forecast results are founded in actual customer level data. The layout of the tool and the dashboards combined an easy to use interface with a powerful tool and ability to have oversight with a high degree of granularity.
The key outcomes:
- Live data connection to a database allowing instant refresh and the ability to draw on 3 years of customer history for each estate, with product holding and offer value KPIs,
- Users can slice data to look at particular combinations of offer holdings and their offer status,
- Campaign offers were assessed by NPV, IRR and payback, relative to a scenario chosen by the user,
- Multiple offers can be stored, overwritten and reinstated using macro controls. Multiple offers are then brought together in an output that helps the user select a group of offers based on a selected outcome.


Client
Our client is a leading telecommunications and technology company, offering a full range of communications services and competing in all telecommunications markets within the United Kingdom.
Purpose
The client required a detailed model to identify customers at risk of pausing or cancelling their sports product holding as a result of COVID-19. The client has over 3.5m active sports customers on their book and were looking for a model to predict the potential decay of this base. Forecast delivered a propensity model for the entire customer base within a tight deadline.
Key deliverables and functionality of the model included:
- Propensity scores split by the three target outcomes–Do Nothing, Cancel, or Pause their subscriptions.
- Strategic, regularly maintained and updated data tables allowing for the timely identification of new pause/cancel customers.
- Analysis of the predictive ability of the modelling suite with evaluation metrics back tested using a short period of actuals.
- The ability to create and investigate customer cohorts for each of the three target outcomes.
- Automation of the end-to-end process to identify active sports customers who have not yet paused or cancelled, predict the risk profile of these customers, and update strategic tables with this risk profile.
- The use of strategic platforms and tools (specifically cloud computing and modelling) to ensure reusability and ongoing consumption.
Approach
Forecast constructed a data pipeline feeding strategic data from Google Big Query onto the GCP AI Platform for further exploratory analysis. Forecast then built and fine tuned a Machine Learning approach that took in the most identifying features to predict propensities on a customer level for the target classes. We delivered a full modelling solution that can be projected on the entire customer base, and re-run frequently to assess the changing circumstances. Forecast delivered this project on a very strict deadline of 3 daysand continues to provide support to the client’s decision-making team.
Outcome
The final model provided key finance decision makers with up to date sports churn propensities for immediate use across a number of potential work streams, ranging from provisioning as a result of lost revenue, mitigation of risk, and defining appropriate communication strategies. These decision makers helped the client navigate the fast paced changes in their customer base due to the unexpected scenario and stay ahead of the curve.


Client
Our client is a provider of subscription television, internet, and mobile services. They have an international reach totalling over 22 million customers and a history of developing innovative products and entertainment content.
Purpose
Our client was looking to increase the utilisation of the core data consumed in their on-site data warehouse and any transformation logic used by migrating the data into Google Cloud Platform (GCP). The aim of this was to increase the usefulness of the data and to be able to respond quickly to change requests to the data structure. As this data was becoming increasingly transformed and transported by our client, the complexity of managing this infrastructure quickly increased. Our client required robust pipelines to be implemented to manage this extra complexity without errors.
Approach
Forecast worked with the client to develop a data structure that was better aligned with the existing business reporting and to include key metrics of interest to the client. Additionally, Forecast designed an automated process to streamline the data transfer from their on premises data warehouse to GCP.
Outcome
Forecast delivered several technical aspects that added value to the client, including:
- A new data structure that allowed for better analysis for current and future value-add projects. This included daily and monthly customer data scaling to multiple Terabytes, where business-applicable metrics could then be derived.
- Automating data transfer processes on robust pipelines – moving from a manual to an automatic schedule. This decreased the total time involved from days to hours.
- A combination of cloud infrastructure (GCP), Python and Windows Batch scripting was used to build a custom tool, specific to the client’s environment.
- The amount of comprehensive data in GCP enabled Forecast to use various advanced technologies on further projects.


Client
Our client manages one of the UK’s largest fleets, comprised of a diverse array of vehicles. They have a fleet of over 5,000 vehicles, covering nearly 47 million miles per year.
Purpose
The client required a way to understand and visualise key aspects of their fleet, utilise their data to their advantage and find opportunities for impactful operational improvements.
Approach
To understand how to provide the best solution, Forecast initially mapped the client’s data landscape and sought to understand the operational aspects and the current data usage and analysis. Working with input from key stakeholders, Forecast built a comprehensive data model using the client’s multiple sources of data in PowerBI. This was done using a combination of Power BI native Power Query and integrated Python and R languages, matching the best tool for each data source. On top of the data model, relevant KPIs were derived and visuals were chosen to best convey the information.
Finally, Forecast grouped the figures and KPIs to tell a story and delivered pivotal PowerBI dashboards that were intuitive and interactive to appeal to a broad range of stakeholders. This involved adopting an iterative approach, including collecting input from the client, to design dashboards that work best for them. In addition, Forecast sourced external data to augment and further add value to the existing datasets and give a new perspective to the client.
Outcome
Forecast delivered bespoke, visually appealing and interactive Power BI dashboards focused on:
- Fuel expenditure, usage and trend analysis
- Collision cost and trends analysis
These dashboards have demonstrated the clear benefits from data-driven decisioning and showcased cost reduction opportunities and operational improvements that may not have been seen previously.


Client
Our client is a provider of subscription television, internet, and mobile services. They have an international reach totalling over 22 million customers, and a history of developing innovative products and entertainment content.
Purpose
Forecast was asked to provide strategic guidance and operational support in streamlining the AB testing procedure within the area of the business charged with improving the customer experience (Content Engagement). The in-house resources were focused on day-to-day reactive analysis and would benefit from the oversight needed to optimise computational procedures that would free up capacity to address more strategic priorities.
Approach
Forecast worked alongside the Content Engagement team and provided both strategic consulting guidelines as well as operational support for day-to-day business. The areas in which Forecast provided added capabilities in this project were:
- Consulting in the creation of a dynamic cohort creation Python-based tool, which led to reducing the time required to provide end-to-end hypothesis testing by over 50%.
- Ongoing statistical support to refine AB test analysis robustness by introducing new ways of working and introducing new software packages.
- Developing a standardised approach to translating and presenting the test findings to stakeholders through actionable insights and recommendations.
Outcome
Forecast delivered statistical capabilities to allow for a streamline of the AB test procedures within the customer experience department. Some of the key outcomes included:
- 50% reduction in effort across the whole AB tests procedure by capitalising on a python-based tool and robust statistical analysis.
- Increased visibility and standards of the AB test key insights and recommendations.


Client
Our client provides highly bespoke loans to the commercial property development sector and is backed by a leading global private equity fund.
Purpose
Our client required a detailed financial model to accurately manage loans on an individual basis for a loan book with a value of c.£500m. Their existing model was both extremely large and unstable and was difficult to operate or audit as an inexperienced user. The model was required to model both the borrower loan and the inter-bank lending that funded part of the overall loan. Further challenges included the requirement for daily time series and the large number of bespoke features of the loan facilities with borrowers.
We subsequently worked with the client to build a suite of dashboards to provide the outputs of the model to the wider business and stakeholders.
Approach
Forecast worked closely with the client’s team to gain a detailed understanding of the funding model and the bespoke nature of the loans. As a result of the daily time series, Forecast required to focus on the calculation efficiency of the tool as a key challenge of the development phase, especially as the number of loans made by the business increased. The Forecast team devised an innovative solution where a single loan calculation sheet was used and then this was copied to a storage sheet via the use of a macro. The model outputs in turn refer to the storage sheets, significantly improving the performance and calculation speed of the model.
The Forecast-developed model:
- Modelled the complex and bespoke elements of each loan
- Had capacity for up to 50 loans to be modelled on a daily time series
- Included a number of new output tools for the client
- Allowed the client, for the first time, to forecast each loan individually in the granular detail required
- Included a suite of interactive loan dashboards that were developed in Power BI, meaning that stakeholders could view the outputs of the model without having to access the underlying Excel model
- Included best practice layout and formatting implemented throughout
- Provides a “golden source” of data for the private equity fund
Outcome
The Forecast-developed model is now the central tool used by the client in the management and reporting of a significant commercial property loan portfolio. This solved a number of challenges for the client’s team who now have a robust and easy to use loan reporting platform. The subsequent addition of PowerBI dashboards allowed the data to be viewed and utilised by colleagues in the operational teams without those individuals requiring access to the complex Excel model generating the financial data.

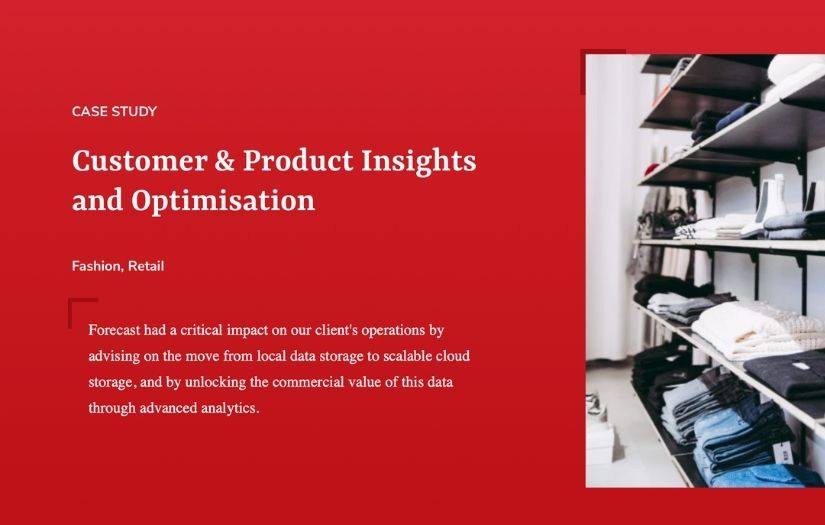
The client required support to achieve commercial goals across multiple sectors with a data driven strategy. Despite the abundance of raw transactional, product, and financial data accumulated in the last few years, our client was still early in their data journey, starting to develop a cloud-based scalable data infrastructure to generate value through analytics. Forecast worked with the internal data analytics team to add value through insightful analytics as well as advanced machine learning solutions across three business lines.
