BoxWatch
Deployment
Overview
About BoxWatch
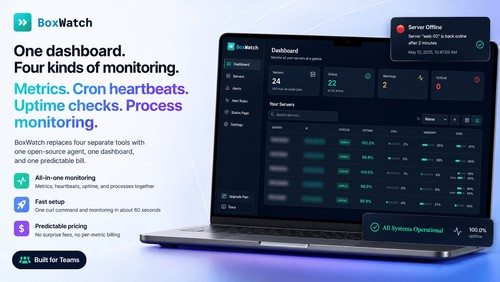
BoxWatch is server monitoring that does the job of four tools at once: metrics, cron heartbeats, uptime checks, and process monitoring. One agent, one dashboard, one bill.
Most teams stitch together Datadog (or similar) for metrics, Healthchecks.io for cron, UptimeRobot for HTTP checks, and a separate supervisor for processes. BoxWatch replaces all of that.
Metrics: CPU, memory, disk, network, load, and uptime, collected by a small open-source bash agent installed with one curl command. Trend charts, side-by-side comparison views, and disk-full prediction that warns you days before a volume actually fills.
Cron heartbeats: ping a URL when a job finishes, get alerted when the ping is late or missing. Four alert types with transition-based dedup so you never get spammed.
Uptime checks: HTTP, TCP, and TLS-expiry probes executed by your own deployed BoxWatch agents. Multi-region as a side effect of your fleet, and capable of monitoring internal-network endpoints that hosted competitors
At a glance
Software information
Industries served, licensing and the support BoxWatch provides.
Industries
- Computer-network-security
- Computer-networking
Licensing
- Proprietary
- Free version
Support
- 24x7 Support
Training
- Documentation
Knowledge Base
Capabilities
BoxWatch features
The full feature set, grouped by module.
Plans
BoxWatch pricing
Media
Screenshots & video