Key takeaways
- Power BI, Tableau, and Looker solve the same analytics problem, but each platform is optimized for different business needs, ecosystems, and levels of analytics maturity.
- Power BI offers the best balance of affordability, ease of use, and Microsoft integration, making it ideal for SMBs and enterprise reporting teams.
- Tableau remains the strongest choice for advanced data visualization, interactive dashboards, and exploratory analytics workflows.
- Looker stands out for cloud-native scalability, centralized governance, and consistent metric management across enterprise data environments.
Data has gradually become the most contested resource in business.
Companies are losing to competitors who read their data faster and act on it sooner.
Microsoft Power BI, Tableau, and Looker are the tools companies reach for in that arms race.
All three help companies answer the same question: what should we do next with our data? But they were built on different bets about who does the analysis, where the data lives, and how much governance a business actually needs.
Pick the wrong one, and you are looking at months of retraining, a migration project, and dashboards nobody opens.
This guide does the proverbial legwork so you don't have to start from scratch. We compare Power BI, Tableau, and Looker across pricing, visualization, data handling, ease of use, and scalability. With enough specificity that you can walk away with a clear answer, not just a longer list of features to Google.
Looking for the right business intelligence (BI) software for your business? Explore top-rated BI and analytics service providers, compare verified reviews, pricing, expertise, and find the best-fit company for your project on Goodfirms.
Why Power BI, Tableau, and Looker are the Top BI Platforms
These three platforms solve the same problem, i.e., turning raw data into decisions, but they have their own ways. Let's find out what the major difference is.
Power BI
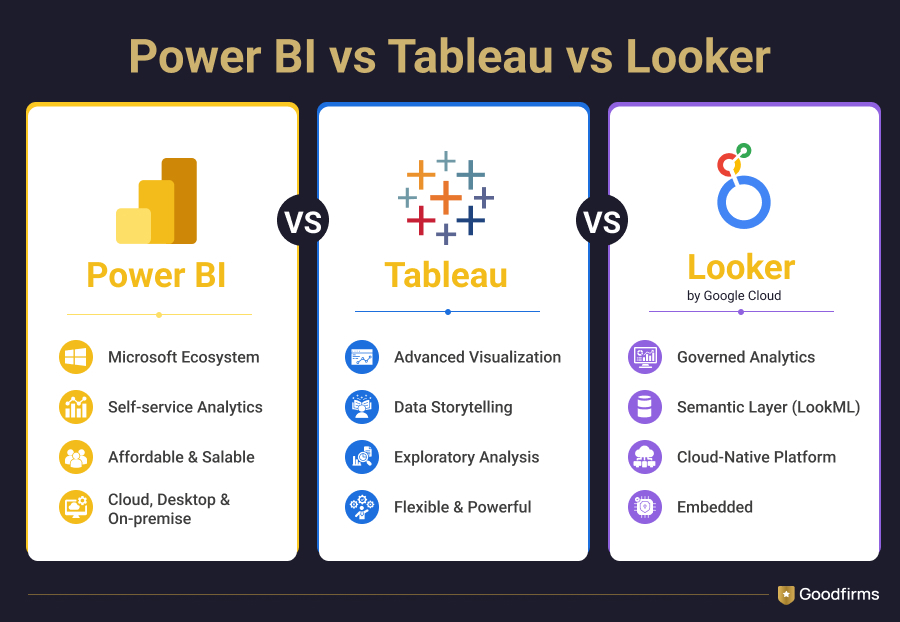
It is Microsoft's business intelligence suite. It connects to hundreds of data sources, builds interactive dashboards, and plugs directly into Excel, Azure, Teams, SharePoint, Microsoft 365, and more.
For organizations running on Microsoft infrastructure, adoption is more like an extension of an implementation project.
The interface borrows heavily from Office conventions, and DAX (Power BI's formula language) will feel familiar to anyone who has spent serious time in Excel.
Tableau
It is owned by Salesforce and was built with the conviction that the best analysis happens when analysts can explore data visually without writing a line of code.
Its drag-and-drop interface handles chart types and dashboard layouts that would require custom development in most other tools.
When the Power BI vs Tableau visualization debate comes up, Tableau is often considered the benchmark for advanced dashboard design and interactive storytelling, which is why it frequently appears among the top-rated data visualization software solutions.
It sets the standard for dashboard polish and interactive storytelling that competitors measure themselves against.
Looker
It takes the most different approach of the three. Google's cloud-based analytics platform is primarily a data governance layer. Looker uses LookML, a proprietary modeling language built on SQL, to let data teams define business metrics once and enforce those definitions on reports, dashboards, embedded applications, and API calls. Every user in the organization pulls from the same calculation.
Power BI vs Tableau vs Looker: The Full Comparison Table
This detailed comparison table breaks down Power BI, Tableau, and Looker across every major parameter, including pricing, visualization, scalability, AI features, integrations, ease of use, and more, giving you almost everything you need to evaluate the right BI platform for your business.
|
Feature |
Power BI |
Tableau |
Looker |
|---|---|---|---|
|
Best For |
Microsoft-stack businesses, SMBs |
Data analysts, enterprises needing advanced visuals |
Large enterprises, data governance, Google Cloud |
|
Starting Price |
Starting $14/user/month |
Starting $15/user/month |
$60,000+/year |
|
Free Version |
Yes |
No |
No |
|
Deployment |
Cloud, Desktop, On-premise (Premium) |
Cloud, Desktop, On-premise |
Cloud-only (Google Cloud) |
|
Learning Curve |
Low–Medium (Excel users adapt fast) |
Medium–High |
High (requires LookML/SQL expertise) |
|
Data Visualization |
30+ chart types, custom visuals marketplace |
Unmatched flexibility and polish |
Clean but less customizable out of the box |
|
Data Volume Handling |
Good; struggles at very large scale without Premium |
Excellent — handles millions of rows natively |
Excellent — built on BigQuery, scales to massive datasets |
|
AI/ML Integration |
Microsoft Copilot, AutoML via Azure |
Einstein Discovery (Salesforce AI) |
Gemini integration (Google AI) |
|
Embedded Analytics |
Moderate |
Good |
Excellent — purpose-built for embedded use cases |
|
Data Governance |
Moderate |
Moderate |
Excellent — LookML enforces a single source of truth |
|
Collaboration |
Strong — integrates with Teams, SharePoint |
Good — Tableau Server/Cloud sharing |
Good — centralized via LookML |
|
Connectors / Data Sources |
100+ native connectors |
80+ native connectors |
50+ direct; 800+ via Looker Studio partner connectors |
|
Mobile Experience |
Good — dedicated mobile app |
Good — Tableau Mobile |
Adequate |
|
Custom Visualizations |
Yes — AppSource marketplace |
Yes — Tableau Extensions Gallery |
Limited |
|
SQL Required |
Optional (DAX is the native language) |
Optional |
Mandatory (LookML is SQL-based) |
|
Ideal Company Size |
SMB to Enterprise |
Mid-market to Enterprise |
Enterprise only |
|
Gartner Magic Quadrant |
Leader |
Leader |
Visionary |
|
Goodfirms Rating |
4.5/5 |
4.3/5 |
4.5/5 |
|
Semantic Layer |
Basic (DAX) |
Limited |
Advanced (LookML) |
|
Cloud-Native |
Partial (hybrid) |
Partial (hybrid) |
Fully cloud-native |
|
Microsoft Ecosystem |
Excellent |
Good |
Limited |
|
Google Ecosystem |
Limited |
Moderate |
Excellent |
Power BI vs Tableau vs Looker: Pros and Cons
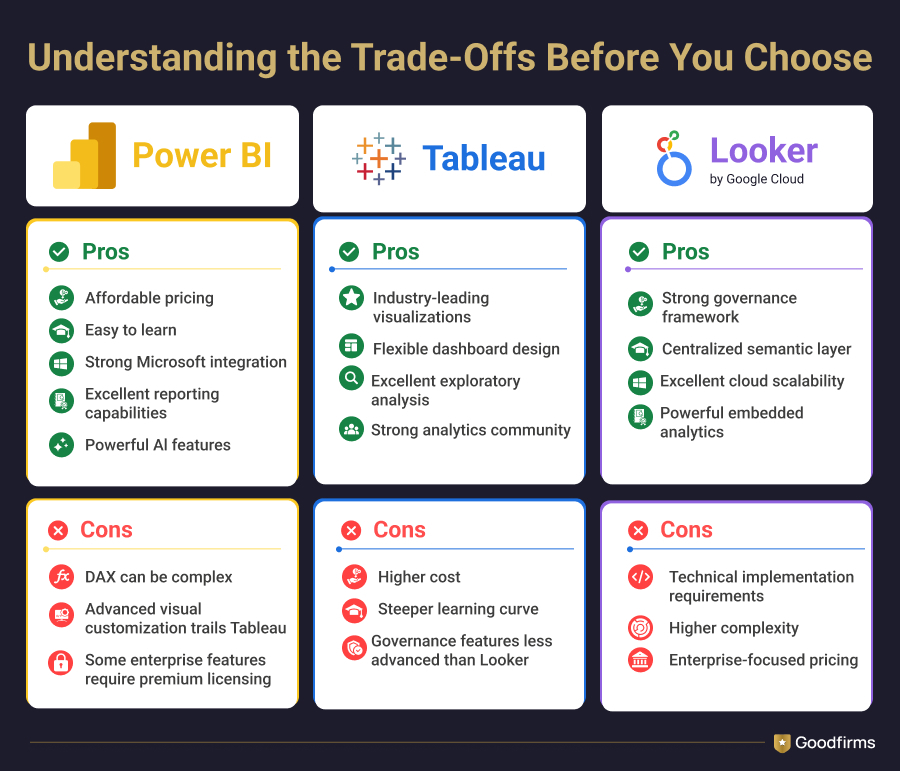
Here’s a quick breakdown of where Power BI, Tableau, and Looker shine, and where each platform may fall short!
Power BI
Pros
- Affordable pricing
- Easy to learn
- Strong Microsoft integration
- Excellent reporting capabilities
- Powerful AI features
Cons
- DAX can be complex
- Advanced visual customization trails Tableau
- Some enterprise features require premium licensing
Tableau
Pros
- Industry-leading visualizations
- Flexible dashboard design
- Excellent exploratory analysis
- Strong analytics community
Cons
- Higher cost
- Steeper learning curve
- Governance features less advanced than Looker
Looker
Pros
- Strong governance framework
- Centralized semantic layer
- Excellent cloud scalability
- Powerful embedded analytics
Cons
- Technical implementation requirements
- Higher complexity
- Enterprise-focused pricing
Which Analytics Platform Should You Choose?
The right BI platform depends on your existing tech stack, analytics maturity, budget, reporting needs, and the level of governance and visualization flexibility your teams require.
When Should You Choose Power BI?
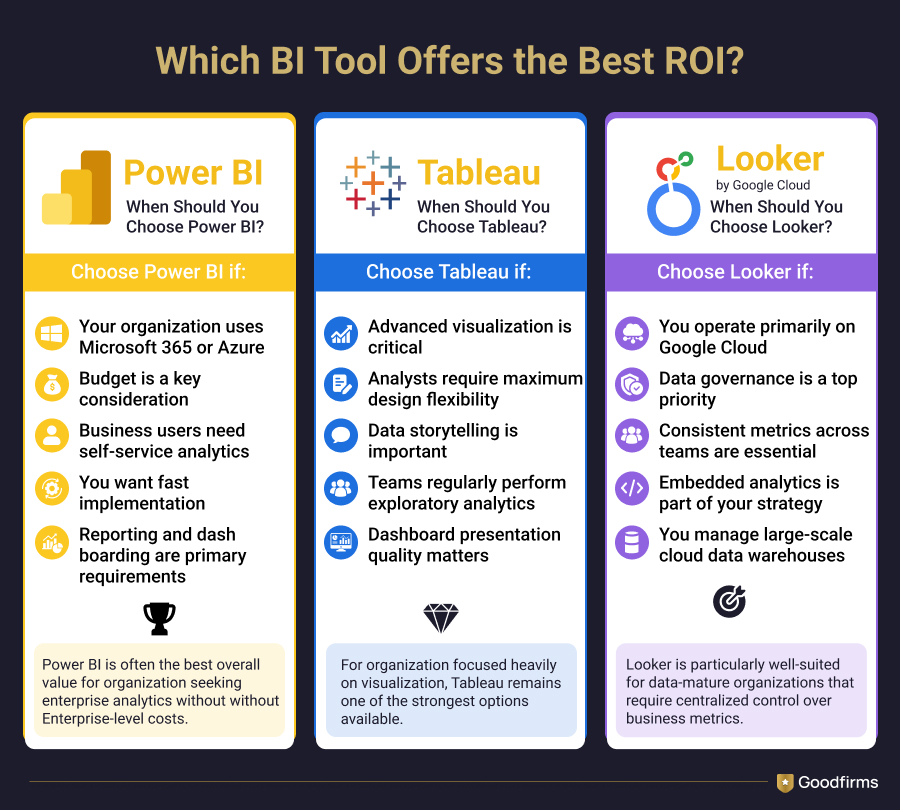
Choose Power BI if:
- Your organization uses Microsoft 365 or Azure
- Budget is a key consideration
- Business users need self-service analytics
- You want fast implementation
- Reporting and dashboarding are primary requirements
Power BI is often the best overall value for organizations seeking enterprise analytics without enterprise-level costs. Businesses focused primarily on operational reporting and executive dashboards should also explore leading reporting software options to compare features beyond traditional BI platforms.
When Should You Choose Tableau?
Choose Tableau if:
- Advanced visualization is critical
- Analysts require maximum design flexibility
- Data storytelling is important
- Teams regularly perform exploratory analytics
- Dashboard presentation quality matters
For organizations focused heavily on visualization, Tableau remains one of the strongest options available.
When Should You Choose Looker?
Choose Looker if:
- You operate primarily on Google Cloud
- Data governance is a top priority
- Consistent metrics across teams are essential
- Embedded analytics is part of your strategy
- You manage large-scale cloud data warehouses
Looker is particularly well-suited for data-mature organizations that require centralized control over business metrics.
Power BI vs Tableau vs Looker: Salary Comparison (USA)
Salary trends matter for businesses because they directly impact hiring costs, implementation budgets, and long-term analytics investments.
|
Role |
Power BI |
Tableau |
Looker |
|---|---|---|---|
|
Analyst |
$84K–$144K |
$79K–$136K |
$104K–$165K |
|
Developer |
$106K–$166K |
$88K–$147K |
$104K–$165K |
|
Consultant |
$100K–$162K |
$105K–$141K |
$104K–$165K |
Power BI is generally considered more cost-effective from a talent perspective because of its larger user base and easier onboarding for Excel and Microsoft users. Businesses can often hire Power BI talent more easily and train internal teams faster.
Tableau professionals may command higher salaries in analytics-heavy environments because advanced visualization and dashboard design skills are highly valued in enterprise analytics teams.
Looker implementations can become more expensive because organizations often need cloud analytics specialists, SQL experts, and analytics engineers familiar with LookML, BigQuery, or modern data stack architectures. For enterprises operating large cloud data environments, however, those higher staffing costs may be justified by stronger governance and scalability.
FAQs—Power BI vs Tableau vs Looker
Is Power BI similar to Tableau?
Both are BI and data visualization platforms, but they take different approaches. Power BI is Microsoft-native, more affordable, and suited to business users. Tableau is vendor-neutral, more expensive, and favored by data analysts who prioritize visualization quality.
Is Power BI cheaper than Tableau?
Yes, but mostly at the entry level. Power BI starts at around $14/user/month, while Tableau's entry pricing starts at about $15/user/month, so the difference initially looks quite small.
The bigger pricing gap appears at the premium and enterprise tiers. Tableau can become significantly more expensive as teams scale, especially for organizations with large numbers of users or advanced analytics requirements. Power BI's premium plans also increase in cost, but many businesses still find Microsoft's pricing structure more affordable overall for enterprise-wide adoption.
Is Power BI easier than Tableau?
For Excel users, yes. Power BI's interface and formula language (DAX) are closer to Microsoft conventions, reducing the onboarding time. Tableau has a steeper initial learning curve but offers greater visualization flexibility once mastered.
Why is Tableau more popular than Power BI in some circles?
Tableau predates Power BI and established its reputation in enterprise analytics before Microsoft entered the market. It remains the preferred tool among professional data analysts and data science teams for its visualization depth and cross-platform compatibility.
Are Power BI and Tableau similar enough to switch between them?
Even though both use dimensional data models, drag-and-drop interfaces, and calculated fields, the execution differs enough that switching requires meaningful retraining.
Is Looker harder to learn than Power BI or Tableau?
Generally, yes. Business users can navigate Looker dashboards easily, but building data models in LookML requires more technical expertise than creating reports in Power BI or Tableau. Organizations rely on analytics engineers or data teams to manage Looker implementations.
When should businesses choose Looker over Power BI or Tableau?
Looker is often the better choice for organizations operating on Google Cloud, using large cloud data warehouses, or prioritizing centralized governance and embedded analytics. It works particularly well for enterprises that need consistent KPIs across multiple teams and applications.
Find Analytics Software on Goodfirms
While Power BI, Tableau, and Looker dominate the BI market, they represent only a portion of the broader analytics ecosystem. Organizations evaluating analytics investments may also want to compare other leading data analysis software platforms based on scalability, AI capabilities, pricing, and integration requirements.
Goodfirms lists and reviews vetted analytics and BI service providers, including certified Power BI partners, Tableau implementation specialists, and data engineering firms with Looker experience. Filter by company size, budget, location, and verified client reviews to find the right fit for your project.