DXcharts
Deployment
Best for
Overview
About DXcharts
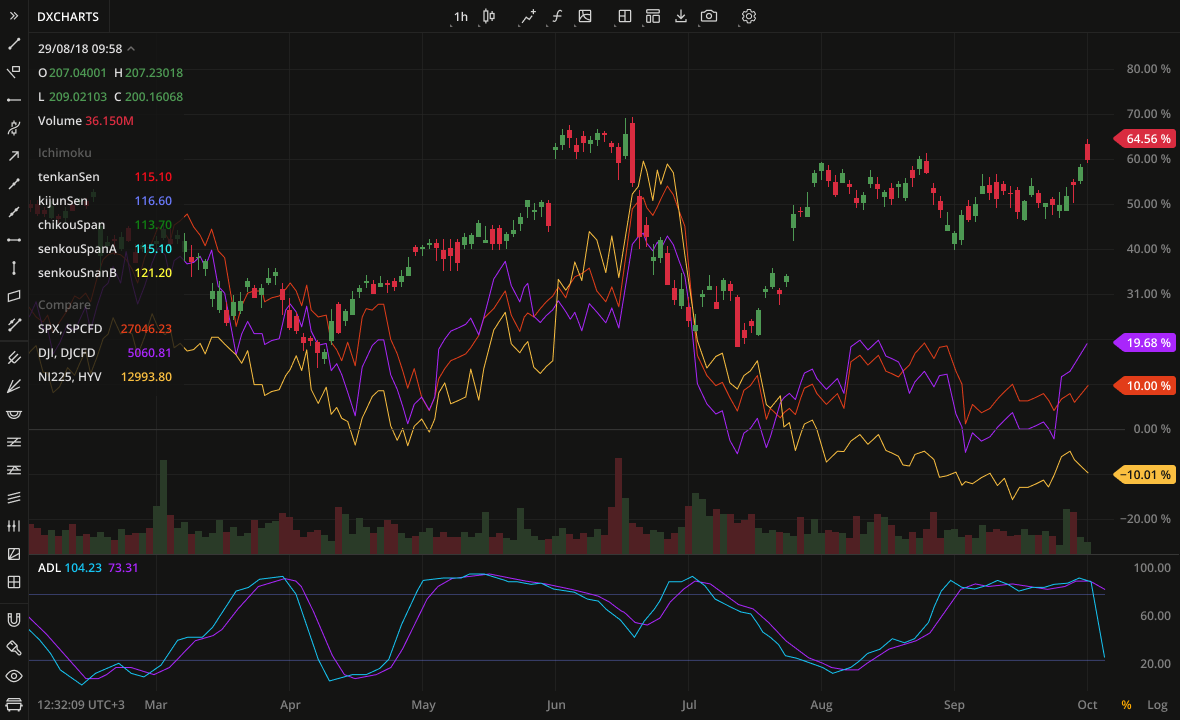
DXcharts is a cross-platform customisable application for technical analysis and market data visualization of multiple asset classes both in real-time and retroactively. You can make changes in the UI or create a completely new custom interface. We have a free-of-charge, a paid SaaS and a full-access lifetime options. Data feeds with
- futures and indices,
- equities,
- FX and cryptocurrencies. You also can plug in any other market data source, as DXcharts is built to be data feed-agnostic.
Native solutions for all platforms: web (JS), native mobile & desktop (Java). Features:
- Multichart layout mode
- 40+ drawings
- 110+ default studies and ability to create new one with the intuitive dxScript
At a glance
Software information
Industries served, licensing and the support DXcharts provides.
Industries
- Banking
- Financial-services
- Investment-banking-venture
Licensing
- Proprietary
- Monthly Payment
- Annual Subscription
- Free version
Support
- Live Chat
- 24x7 Support
Training
- Webinar
- In-person
- Documentation
Capabilities
DXcharts features
The full feature set, grouped by module.
Plans
DXcharts pricing
Media
Screenshots & video