“We are surrounded by data, but starved for insights.” -Jay Baer (American Author). Having Data does matter, but what you do with it matters more. Marketing Managers around the world have to take a lot of decisions every day based on the data available to them. Often marketers find themselves immersed in the flood of enormous data but no exact conclusion. Here, statistical analysis comes to their rescue. Statistical analysis makes it easy for them by deriving conclusive figures that can help marketers to take important decisions. That is why statistics is important for making business decisions.
However, collecting data and analyzing it for deriving statistical conclusions are not easy tasks. Fortunately, technology is there to provide relief to present-day businesses. There is software that can analyze a huge amount of data for the final results.
What is Statistical Analysis Software?
Statistical Analysis softwareis capable of integrating, analyzing, and interpreting a massive amount of data in a statistical framework. It can apply multiple statistical tests and categorize data for finding unique readings. It can compare two or more data types to find statistical similarities or variations. Statistical software is mostly used in quantitative research for data analysis.
Need for Statistical Analysis Software:
Businesses are constantly in search of statistics related to their fields. They need something concrete to rely on while taking informed business decisions. The scale at which businesses work today is quite large, and the data available is huge. It is not possible for managers or statisticians to analyze the data manually. A lot of data inaccuracies can creep in due to human errors.
Statistical software has features to combat the common statistical errors related to categorical data analysis. With categorical data, marketers may not find the relevant information required to make decisions. A bag manufacturing company classifies its products into various categories.-Hand Bags, backpacks, trolley bags, ladies purse, wallet, etc. This is an example of categorizing (discrete characteristics). The problem with categorical data is that there is no mathematical meaning to it. If the company checks the revenue bills and finds that out of all its products, 6 million trolley bags were returned by customers in two years out of the 30 million sold, it means, the company is using the continuous data (variables of measurement) to derive at this conclusion. Continuous data can be analyzed for statistical inferences. The statistical inference is that 20% of goods sold were returned.
Take another example. A production manager decides to divide the quantity of Ice-cream production month-wise equally. He has categorized the production quantity from January to December equally. It is a statistical fallacy. He misses the point that the sales department will require more ice-cream in the months of May-July as it is a common fact that ice-cream sells more in Summer. It is the limitation of the categorical data, and that is why continuous data is required to give a clear view of the situation.
That is why continuous data is more important than the categorical one. Statistical analysis software has the inbuilt features to identify the type of data it is processing, and based on it; the software applies the required test. For categorical data, the software uses descriptive statistics, and for continuous data, it uses linear regression, time-series, and many more. Similarly, it has features to get rid of inaccuracies deriving from improper use of cluster algorithms and segmentation.
To avoid data inaccuracies and to save time, managers rely on applications and software suites that are capable of performing statistical analysis. These software help managers save a lot of time and also make the process easy for them. Applying statistics to data requires marketers to conduct a lot of tests on the data for the final results. The applying, processing, and interpreting part of these tests requires a statistical analysis software.
Statistics resolves a lot of issues in marketing. Statistics clears the vision and gives complete control of the situation to the marketers.
Statistics:
- Provides a clear understanding of the situation
- Produces concrete data to act upon
- Increases accuracy in decision making
- Improves the quality of decisions
- Gives insights for strategic decision making
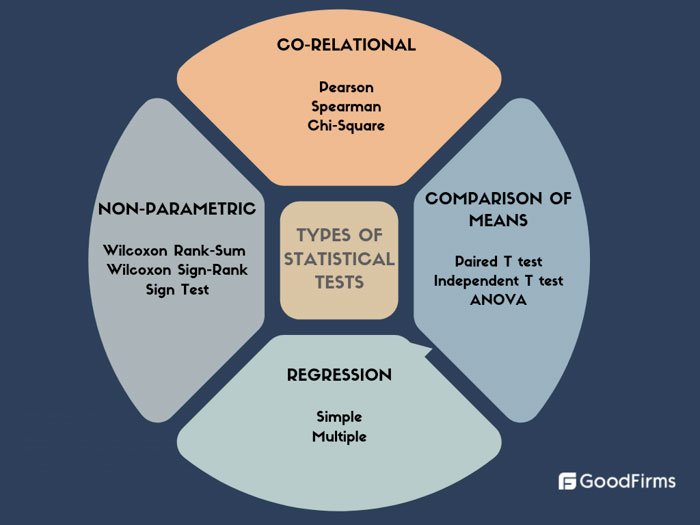
Types of Statistical Tests:
Statistical software should be able to conduct the essential statistical tests shown in the below figure:
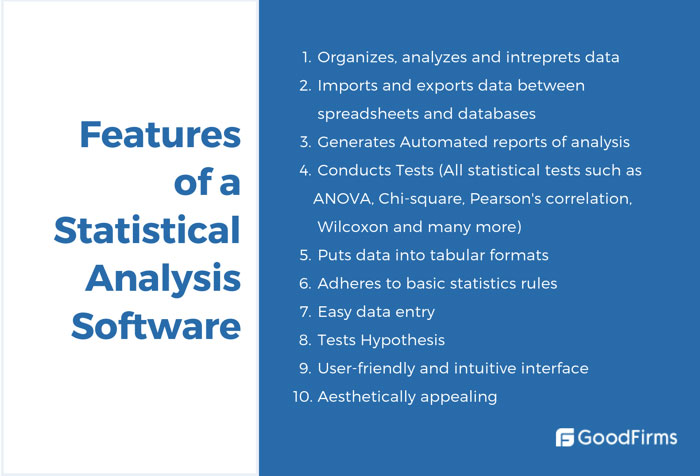
Features of a Statistical Software:
Statistics itself has developed a lot in recent years. Prominent statisticians around the world have introduced various new tests and analysis types, thereby adding new aspects and dimensions to the field of statistical analysis. Statistics involves multiple tests, correlations, variable-analysis, and hypothesis testing, that makes it a complicated process.
A statistical analysis software has the following features to make complicated statistical functions easy.
Below is the list of 10 free and open source statistical software
- JASP
- SOFA
- GNU PSPP
- SCI LABS
- Jamovi
- MacAnova
- Past
- Develve
- Invivostat
- IBM SPSS
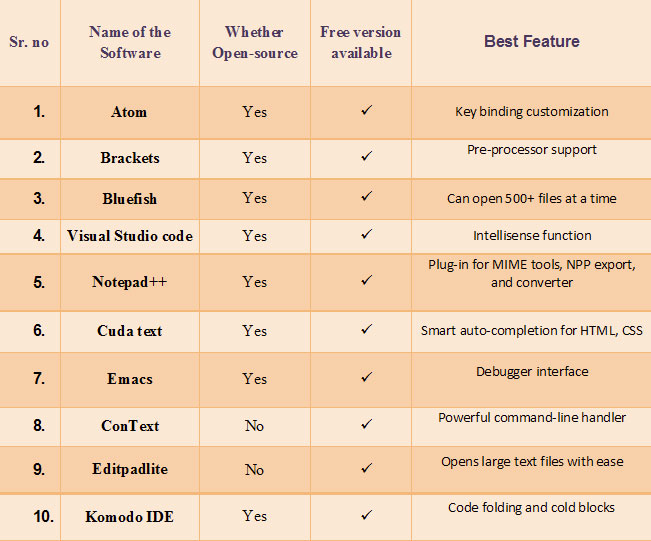
Comparison Chart of the 10 free and open source statistical analysis software:
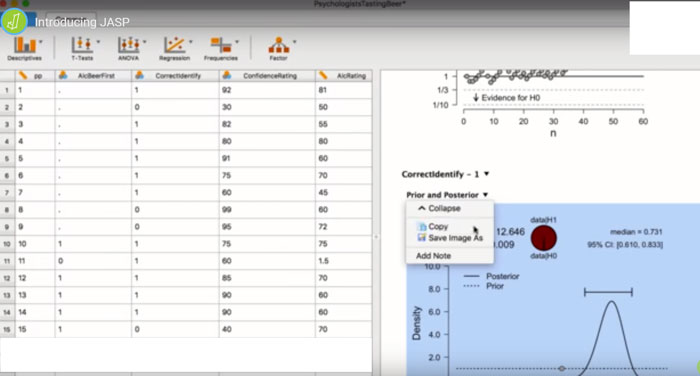
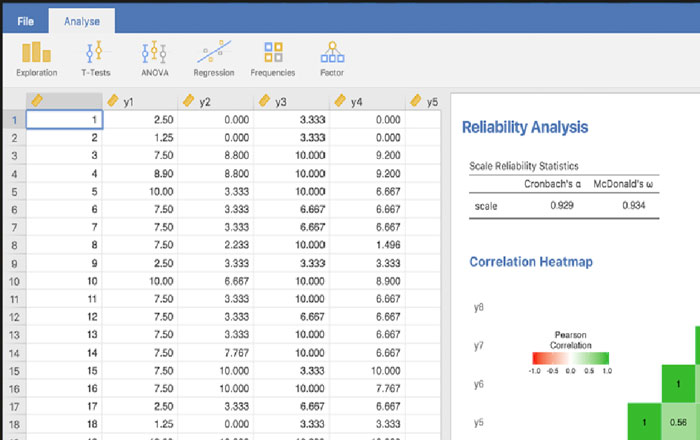
Jeffreys’s Amazing Statistics Program (JASP) came into existence as a free and open source alternative to SPSS with powerful Bayesian analyses as its core feature. It has a user-friendly interface. Results are annotated with descriptive text to make analysis easy.
Features:
- Frequentist analysis
- Bayesian analysis
- OSF Integration
- Supports APA format
- A/B Test (Beta)
- ANCOVA
- AUDIT (module)
- Exploratory Factor Analysis (EFA)
- Bain (Beta module)
- ANOVA
- Mediation Analysis
- Repeated Measures ANOVA
- Reliability Analyses: α, λ6, and ω
- Multinomial
- Binomial Test
- Confirmatory Factor Analysis (CFA)
- Contingency Tables (incl. Chi-Squared Test)
- Summary Stats
- T-Tests: Independent, Paired, One-Sample
- Correlation: Pearson, Spearman, Kendall
- Linear Regression
- Structural Equation Modeling (SEM)
- Logistic Regression
- Log-Linear Regression
- MANOVA
- Principal Component Analysis (PCA)
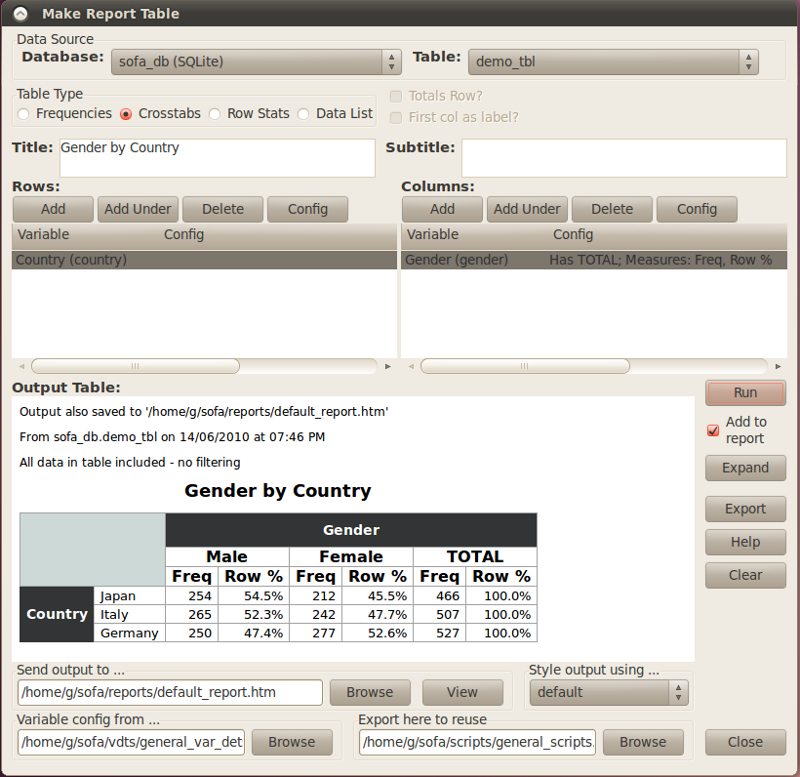
Sofa is a free and open source statistical analysis software developed in the python language. It is a widely used statistical software for its exemplary features and shareable format.
Features:
- Presentable output
- Automated reporting
- Data Integration with MySQL, MS Access, MS SQL, SQLite
- The tabular format supports Excel
- Import data from Excel
- One-way ANOVA
- Mann Whitney U
- Range
- Pearson's Chi-Square with Contingency Tables
- Independent samples t-test
- Wilcoxon Signed Ranks
- Kruskal Wallis H
- Pearson's Correlation
- Spearman's Correlation
- Mean
- Median
- Lower Quartile
- Upper Quartile
- Standard Deviation
- Sum
- N items
- Min observation (smallest)
- Max observation (largest)
- Paired samples t-test
- HTML output for Tables
- Various Chart options
- Export data to Excel
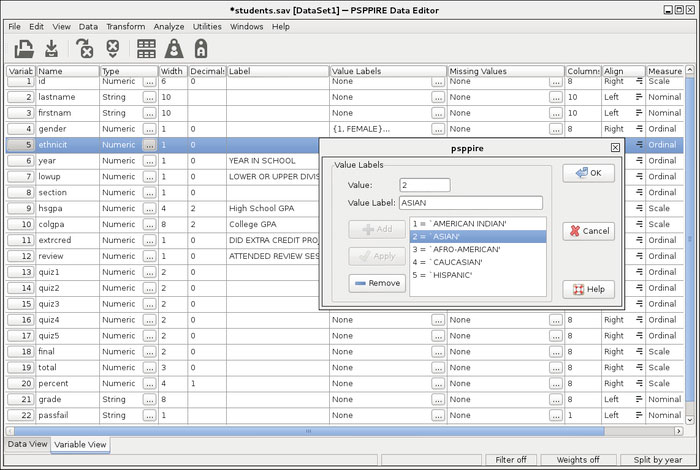
GNU PSPP originated as an alternative to SPSS. This free and open source software has high output formatting features. Its fast performance capabilities allow users to process data efficiently quickly. It can perform all functions that are available with IBM SPSS. The exclusive features like importing from Postgres or extracting data from Gnumeric makes it one of the most popular free and open source statistical software.
Features:
- Lifetime license
- Over 2 Billion variables
- Data Integration with Libreoffice, Gnumeric
- Import data from Excel
- One-way ANOVA
- Multiple data sheets analysis simultaneously
- One billion cases
- Runs on any OS
- Descriptive statistics,
- T-tests,
- Linear regression
- Non-parametric tests
- Various Chart options
- Output in all file formats
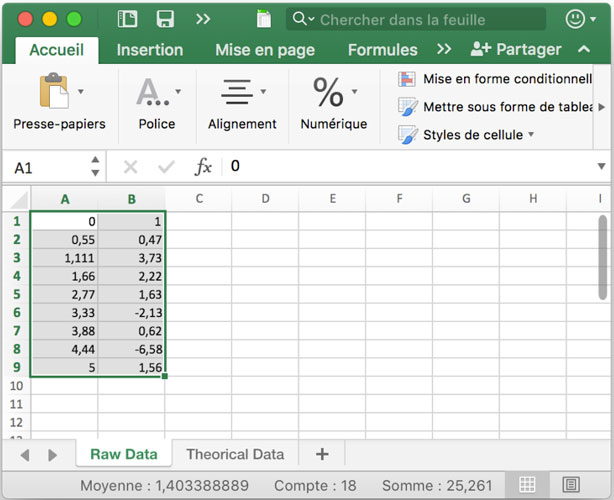
SCI Labs is a software to perform data analysis, provided under GPL license. It is an open source statistical analysis software with high-quality computation, statistics, and modeling capacities available to use for free. It is mostly used by engineers and data scientists for industrial statistical calculations. It performs large data sets with great interface and functionalities.
Features:
- Descriptive statistics
- Standard Deviation
- Variance analysis
- Median
- Data analysis and modeling
- Probability Distribution
- Linear and non-linear modeling
- Regression Tests
- Graphic functions to export data
- Customized chart options
- Graphics formats: PPM, EMF, EPS, PNG, FIG, PDF, SVG
- Advanced data structures
- Skewness and kurtosis
- SCI histplot
- Frequency Distribution Tests
- Probability tests
- Basic statistics functions
- Manual for statistical analysis
Jamovi is a free and open source statistical software built on ‘R' language. Intuitive interface, quality spreadsheet, optimized analysis are the key reasons for its popularity. It performs all statistical tests with reliability and competence.
Features:
- T-tests
- ANOVAs
- Correlation and regression
- Linear regression
- Runs with R code
- Functional Spreadsheet
- Non-parametric tests
- Contingency tables
- Reliability and factor analysis
- Research design analysis tool
- Estimation of interactions for linear models
- Simple slopes
- Simple effects
- Post-hoc tests
- Contrast analysis
- Normality tests (Kolmogorov-Smirnov and Anderson-Darling
- Bayesian methods
Developed by the University of Minnesota this free and open source software works with three operating systems; Windows, Linux, and Mac. In statistics, analysis of variance holds an important place. MacAnova is known for its powerful functioning with multi-variate exploratory statistics
Features:
- T-tests
- ANOVAs
- Correlation and regression
- Analysis of variance
- Matrix algebra,
- Time-series analysis
- Uni- and multi-variate exploratory statistics MANOVA
- Hierarchical cluster analysis
- K-means cluster analysis
- Discrimination and factor analysis
- Stepwise discriminant analysis
- Macros for ULS, GLS and ML factor extraction
- Varimax, quartimax factor rotation
- Equimax and orthomax factor rotation
- Means, variances, medians
- Quartiles,
- Skewness
- Robust ANOVA and regression
- Logistic regression
- Probit regression
- Poisson regression
- Linear modeling
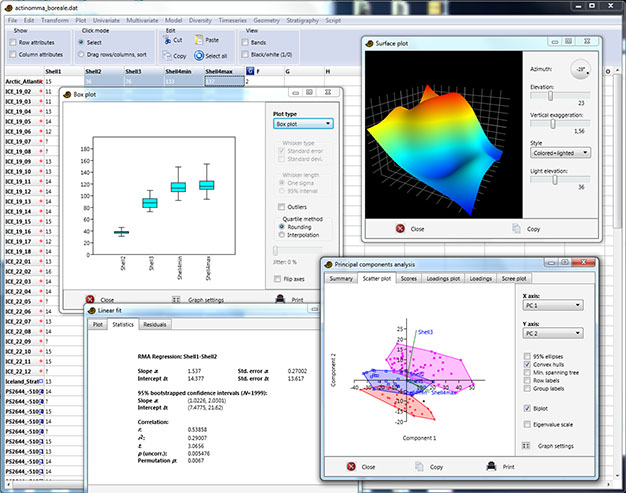
This user-friendly statistical software is free to download and works with Mac and Windows operating systems. Past provides users with a detailed manual to use statistical analysis software. Past can conduct multi-variate statistics with ease and accuracy. Past can also do spatial analysis and ecological analysis.
Features:
- Binomial proportion
- T-tests
- F tests for equal variance
- Man-Whitney test
- Mood’s median tests
- Kolmogorov-Smirnov
- Anderson-Darling test
- One way Anova
- Normality test
- Contingency Test
- Generalized linear model
- Polynomial regression
- Time series relation
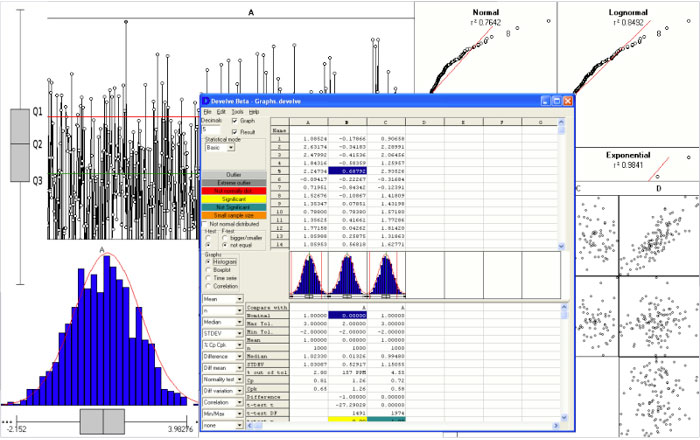
This free statistical analysis software performs statistical data interpretation, and it comes handy with features like Response Surface Methodology (RSM) and Design of Experiments (DOE). With capacities to prevent false assumptions and provide accurate results, this software is one of the best free statistical tools available for computing statistical data.
Features:
- Mean
- Sample counting
- STDEV
- Median
- Cp Cpk % out of tolerance
- Min/Max observation of the range
- t-test
- Wilcoxon–Mann–Whitney-test
- Variation F-test
- Variation Levene test
- Anderson Darling normality test
- Correlation test
- Regression
- Multiple linear Regressions
- Sample size calculations
- Kurtosis
- Skewness
- filter
- Box-Cox transformation
- Generate distribution
- Proportion calculation
- Chi-Square test
- One way Anova
- Kruskal-Wallis Test
- Graphs
- Distribution fitting
- Up to 12 levels
- 10 repetitions
- Interactions
- Anova DOE
- Confirmation run
- Including response graphs
- Nested Gauge R&R (destructive
- Weibull analysis
- Weibayes
Many times invalid data with inaccuracies may result in a null and void outcome. Invivostat has features to identify the inaccurate data and remove it from the final analysis. It makes invivostat compelling statistical software for marketers. It is free to use the software, and it works on the ‘R' platform.
Features:
- Statistical results include ANOVA/ANCOVA table,
- Residuals vs. predicted plots,
- Normal probability plots,
- Least square (predicted) means with confidence intervals, and
- Post-hoc tests (unadjusted (LSD),
- Dunnett’s,
- Tukey,
- Holm,
- Hochberg,
- Hommel,
- Benjamini-Hochberg and
- Bonferroni.
- Overall effects table,
- Residuals vs. predicted plots,
- Normal probability plots, least square (predicted) means with
- Confidence intervals and
- Post-hoc unadjusted pairwise comparisons
- P-value adjustment procedures
- Holm, Hochberg, Hommel, Benjamini-Hochberg, and Bonferroni
- Non-parametric tests include Mann-Whitney tests
- Wilcoxon tests-Kruskal-Wallis test, Behrens-Fisher
- Linear regression and multiple linear regressions.

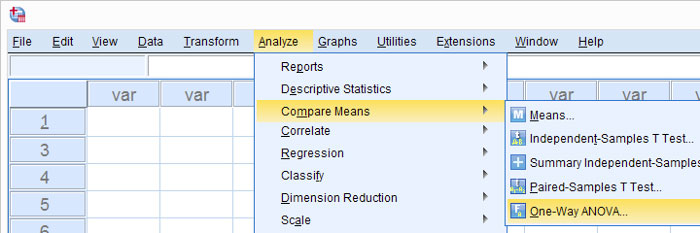
The importance of this software lies in the fact that the tech giant IBM acquired it for its robust features, high-end capacities to perform statistical functions, and sophisticated graphical user interface. Since its acquisition by IBM, it has improved a lot, and today it is used by many universities, businesses, researchers, and organizations.
Features:
- Graphs Basic hypothesis testing
- Bootstrapping
- Cluster analysis
- Data access and management
- Data preparation
- Graphs and charts
- Help center
- Nonparametric tests
- One-way ANOVA
- Output management
- Programmability extension
- ROC analysis
- Support for R/Python
- T-tests /ANOVA /chi-square etc.
- Regression
- GLM
- Factor/cluster/discriminant analysis
- Multidimensional scaling
- Forecasting
- Simulation
- Time series to name a few
- 2-stage least squares regression
- Bayesian statistics
- Generalized linear mixed models (GLMM)
- Generalized linear modeling (GLM)
- Logistic regression
- Loglinear analysis
- Multivariate analysis
- Nested tables
- Non-linear regression
- Probit response analysis
- Quantile regression
- Repeated measures analysis
- Survival analysis
- Weighted least squares regression
Conclusion:
When we are in an unknown territory, we rely on maps to guide us because it provides us the guidance that we need to trail the unknown path. Maps are not just random lines drawn on a piece of paper, but they are charted after a thoroughly calculated mapping process. It makes them reliable and valuable. Similarly, companies venturing out in unexplored trajectories need filtered data to guide them. Statistics does this filtering of data for finding out the value statements. Statistics gets rid of the massive data and brings valuable facts on the table.
Everyone today is a data-driven. For running mainstream businesses, relying just on experience, instincts, or goodwill is no longer sufficient.
When businesses are uncertain of the qualitative data that they possess, then quantitative analysis with the help of statistics can really provide them a concrete piece of information to make decisions.
The beauty of statistics is that companies need not talk to each customer to find out their views about their products and services. Sampling a representative group and applying statistical tests would itself result in extremely helpful insights about the whole group. Also, with statistics in hand, it becomes easy for managers to convince their board, stakeholders, or sub-ordinates of any change they might want to bring.
With the assistance of statistical software, managers can ensure consistent growth, customer satisfaction, strong points in their businesses, and the weaknesses that are hampering growth.
Marketers, businesses, researchers, and concerned entity can use the statistical analysis software discussed in the article for their statistical requirements.
You may even share your thoughts in the comments section below. If you have used any of thestatistical analysis software mentioned above, then do share your feedbackwith us.
If you wish to refer to anystatistical analysis softwareor any other software category other than statistical analysis software, then do look at our software directory.


