
Grafieks
Build for faster insights and smarter decisions
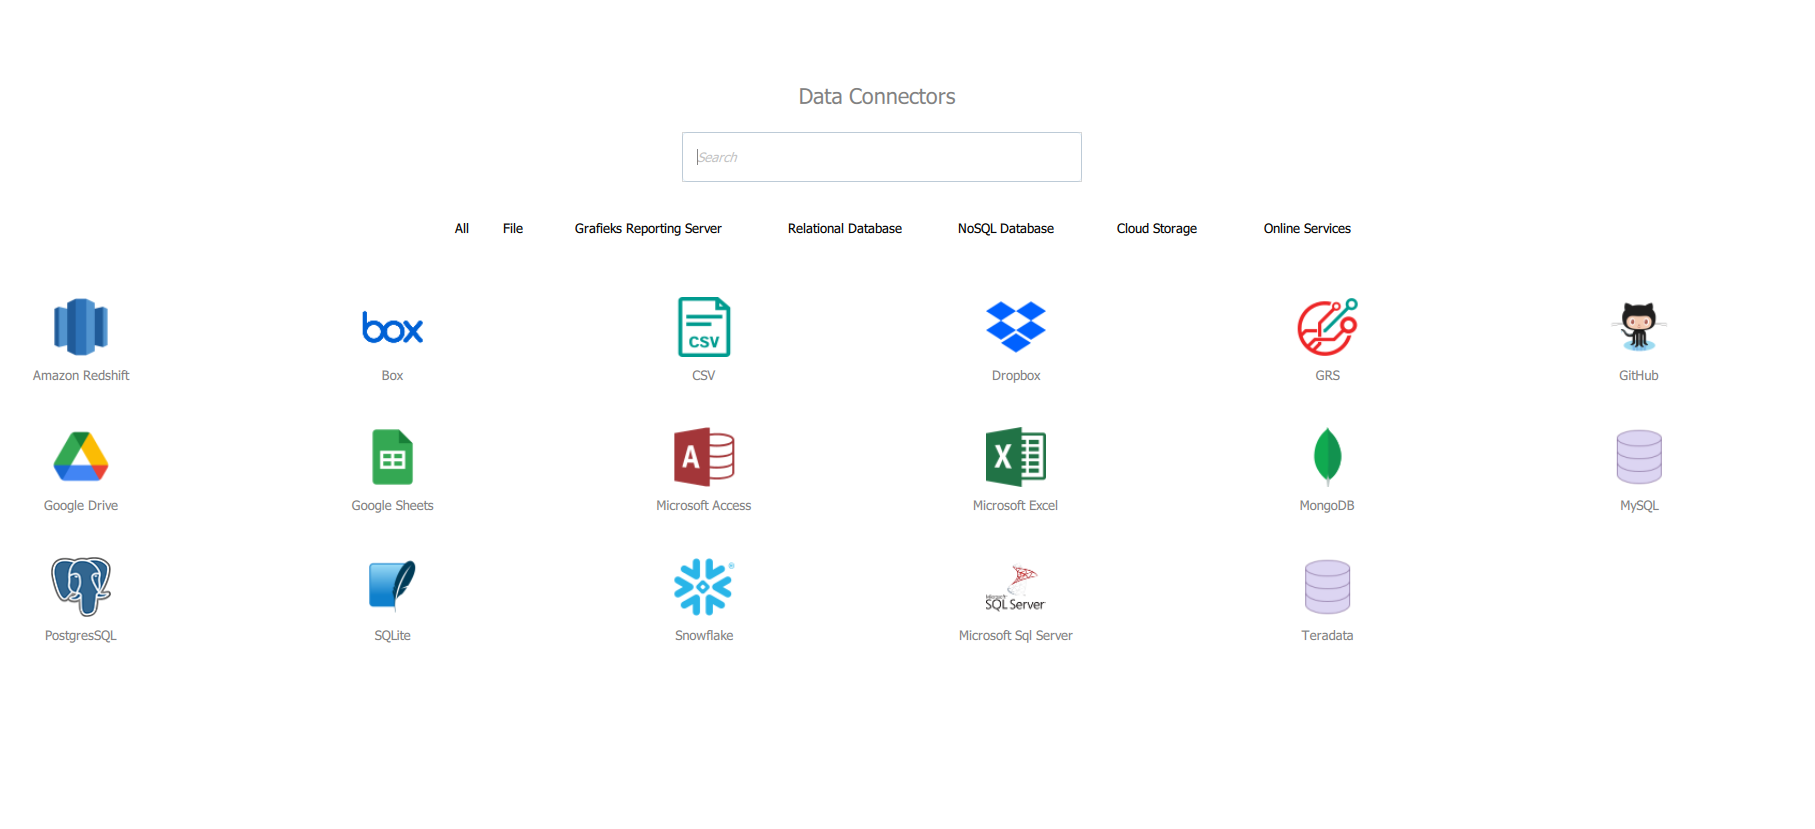
Grafieks is an easy-to-use self-service Business Intelligence platform that allows users to quickly and easily extract meaningful insights from data. Grafieks provides users with an intuitive interface, and simple setup, and offers a way to easily visualize their data as beautiful dashboards. With Grafieks anyone can connect to their data, build data models or write SQL queries, and build reports on their own.
2020
Ireland
- Logistics-supply-chain
- Medical-device
- Package-freight-delivery
- Pharmaceuticals
- Transportation-trucking-railroad
- Warehousing
- English
Industries
-
Logistics-supply-chain
-
Medical-device
-
Package-freight-delivery
-
Pharmaceuticals
-
Transportation-trucking-railroad
-
Warehousing
Licensing & Deployment
-
Open Source
-
Cloud Hosted
-
Web-based
-
Windows
Support
-
Email
-
Phone
-
WeekdaysSupport Days
- Monday
- Tuesday
- Wednesday
- Thursday
- Friday
Support Time- 09:00 to 18:00 (ECT)
- 09:00 to 18:00 (IST)
Training
-
Webinar
-
Documentation
Knowledge Base
Media
Grafieks Core Features
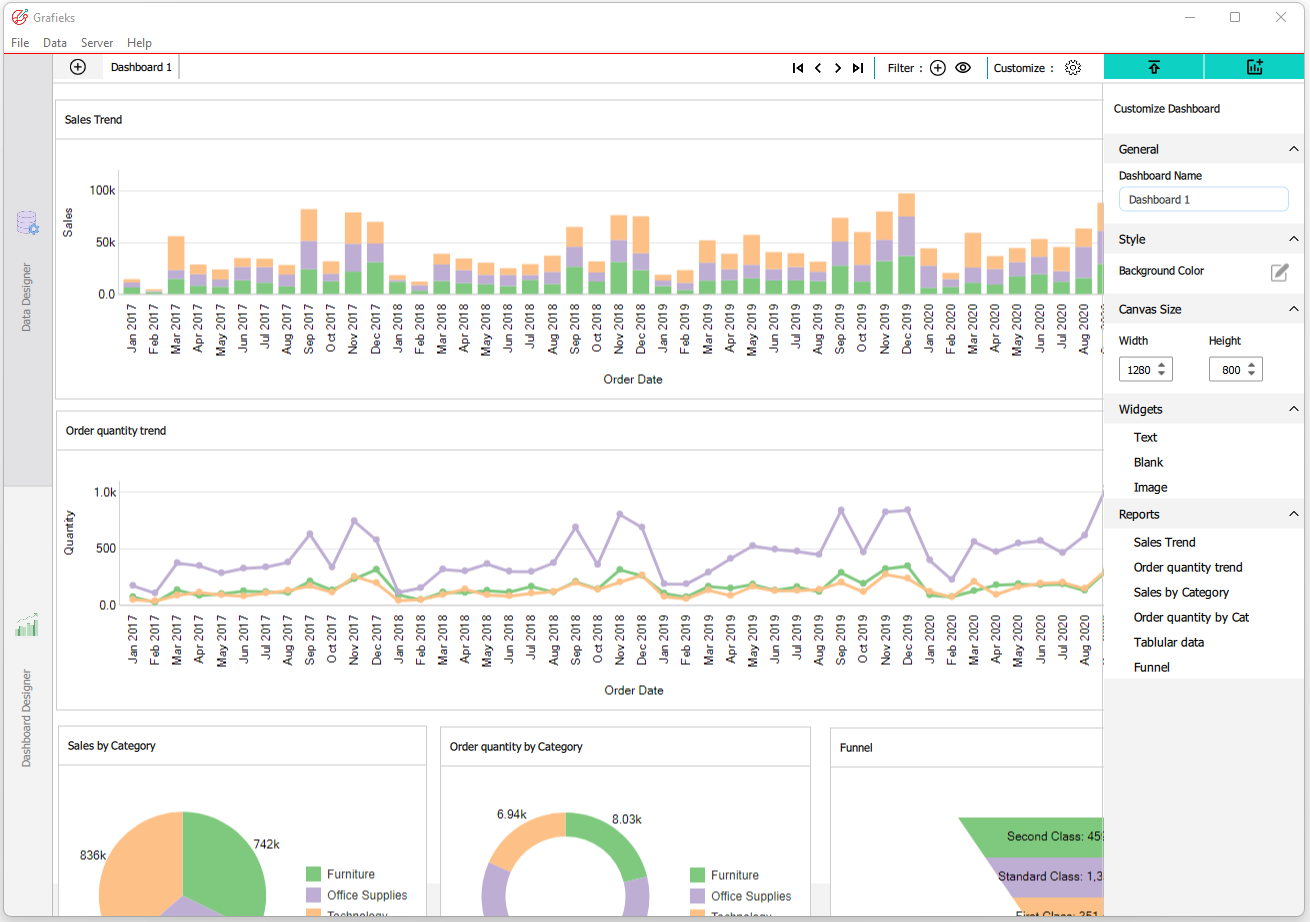
Focus of Data Visualization Feature
- Dashboard
- Data Import/Export
- Filtered Views
- Relational Display
- Reporting & Analytics
- Visual Discovery
Grafieks Pricing
Pricing Type
-
Per User
Preferred Currency
-
USD ($)
Free Version
-
Yes
Payment Frequency
-
Annual Subscription
Pricing Description
1) Grafieks Desktop: Free forever
Desktop application for connecting to data, report and dashboard creation, and publishing to Grafieks Reporting Server for collaboration.
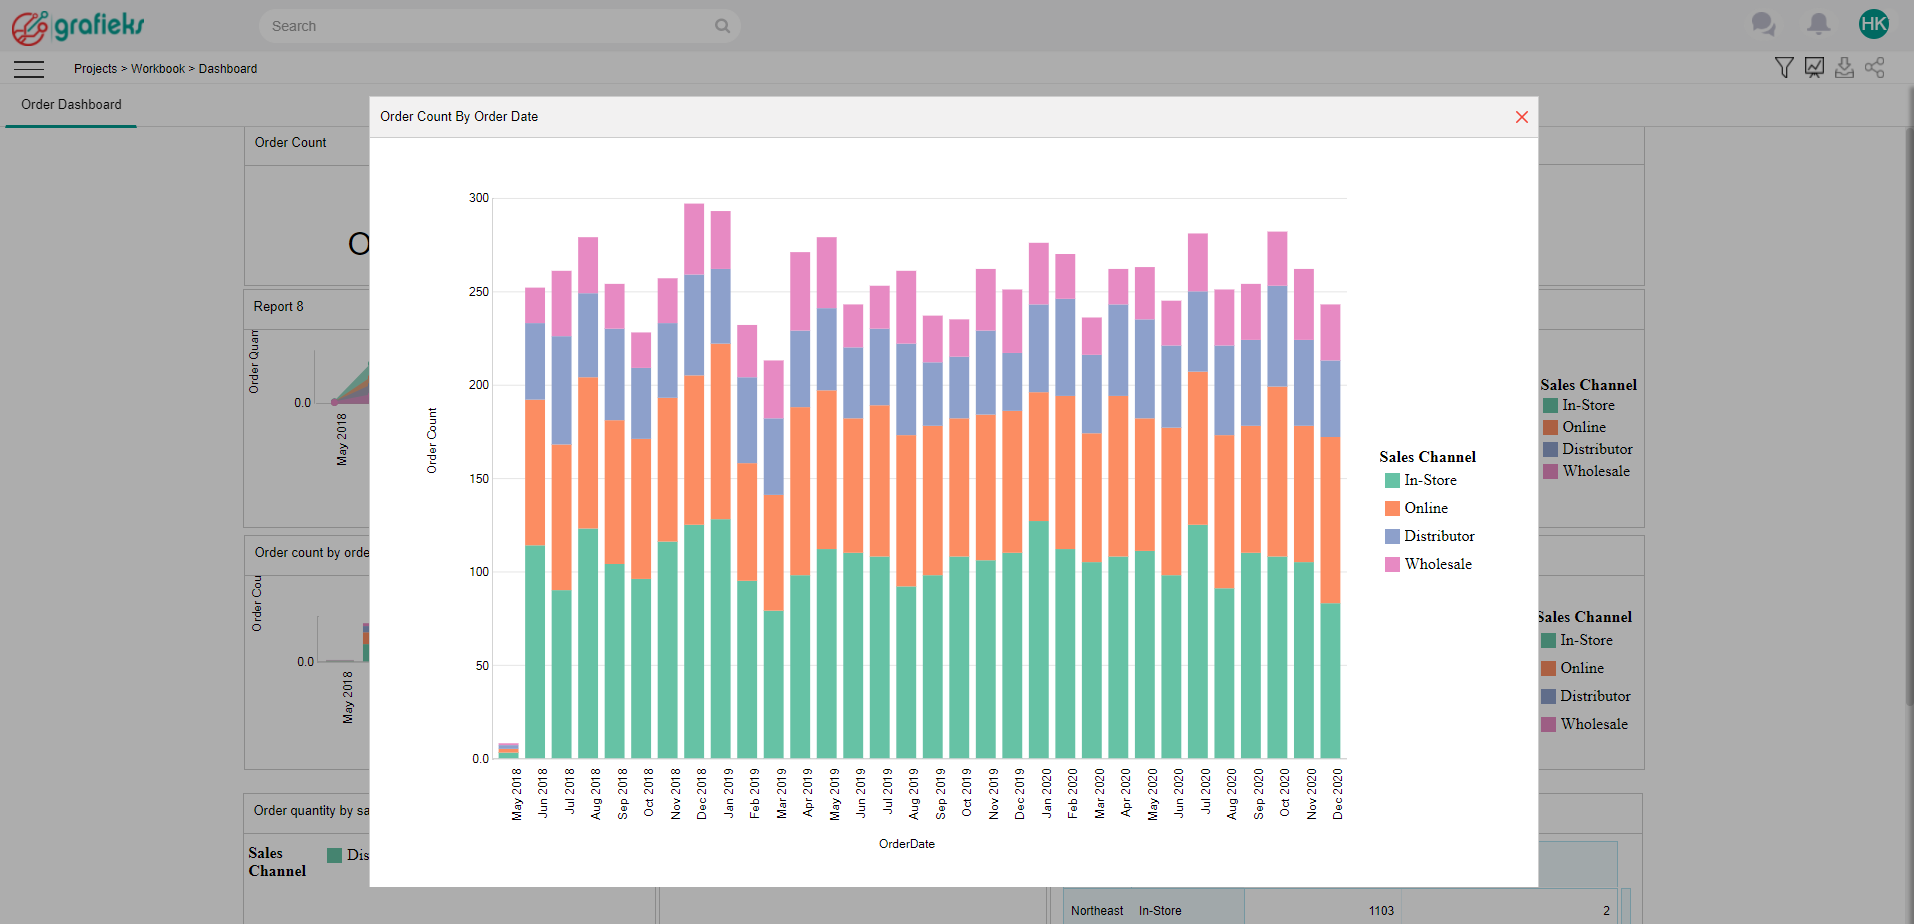
2) Grafieks Reporting Server: Start with the free subscription. Upgrade when required.
SaaS application for sharing insights and collaboration
Desktop application for connecting to data, report and dashboard creation, and publishing to Grafieks Reporting Server for collaboration.
2) Grafieks Reporting Server: Start with the free subscription. Upgrade when required.
SaaS application for sharing insights and collaboration
