VIZUALIZE SURVEY DATA WITH EASE
VIZUALIZE YOUR SURVEY DATA WITH EASE
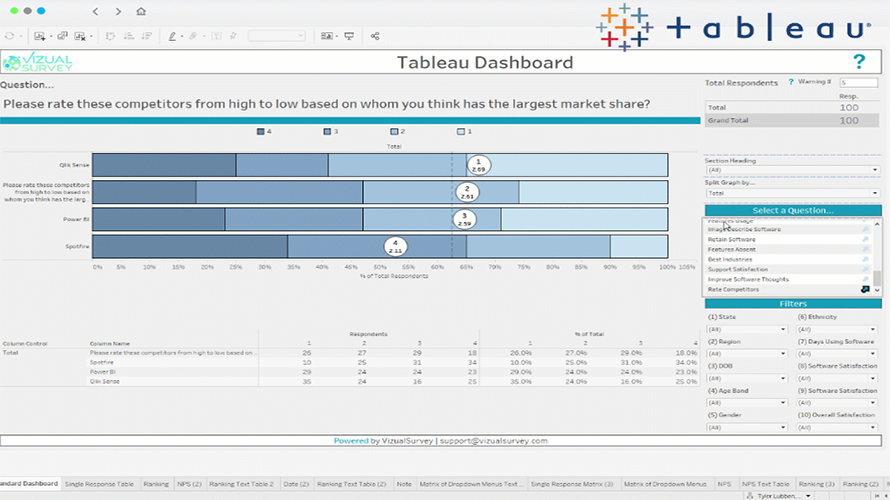
Clean, transform and visualize survey data quickly in any of the top data visualization tools. Download our customizable ready-to-use Tableau, Power BI, Qlik Sense or Spotfire survey dashboard templates to get you going in under 30 minutes.
How VizualSurvey Works:
Use VizualSurvey to clean your survey data then connect it to one of our survey dashboard templates or build your own.
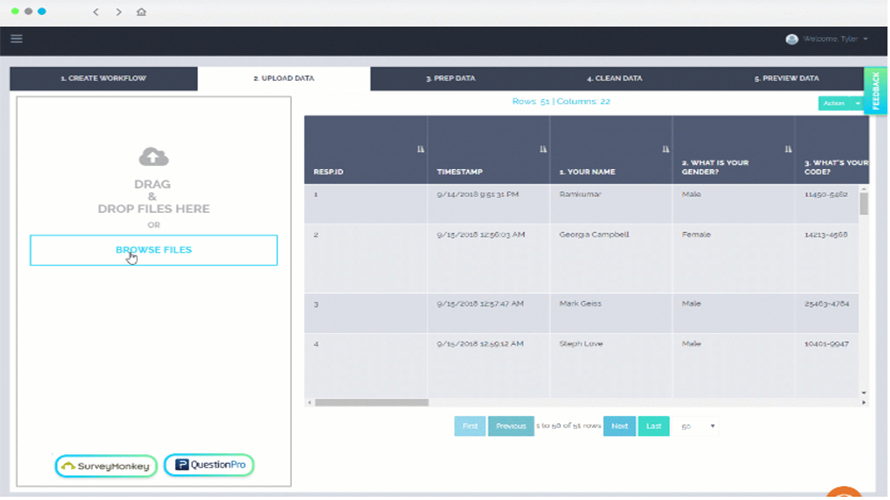
1. Connect or Upload Survey Data
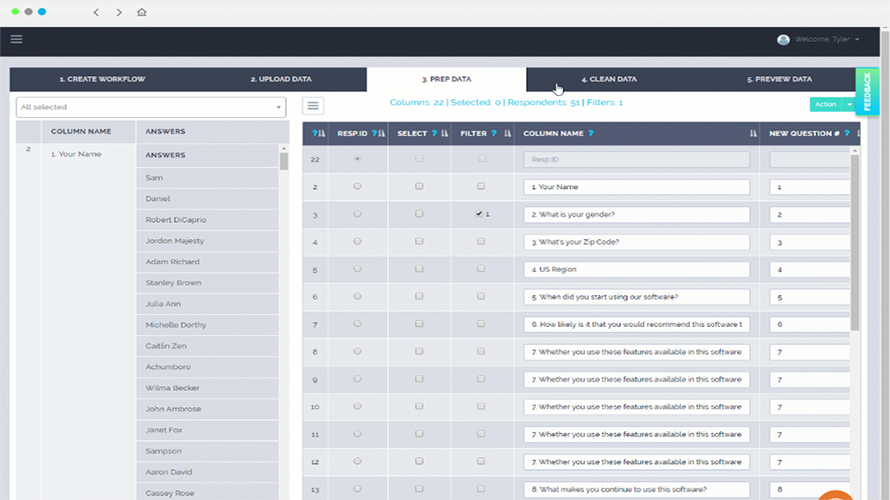
2. Clean Survey Data
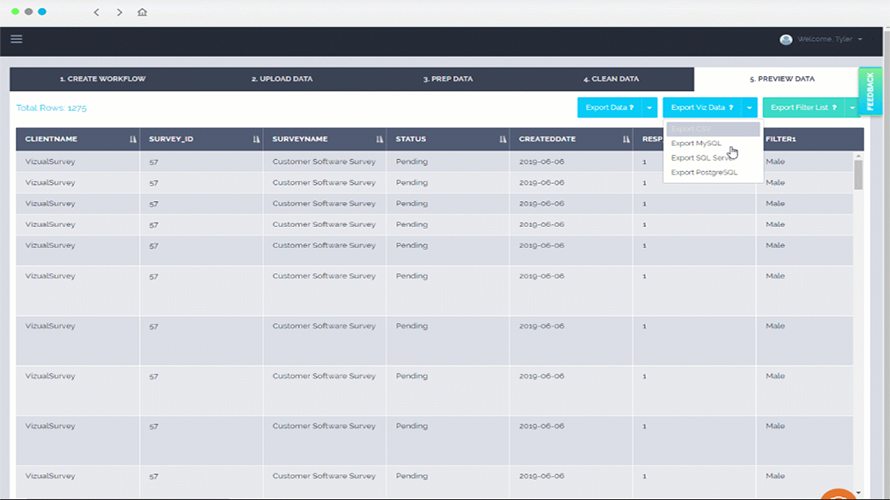
3. Visualize Survey Data
Try VizualSurvey for free today, and you’ll soon be visualizing survey data like never before.