Synopsis :
A volatile and vibrant market always is intriguing especially in terms of revenue index. Competitors behave like two fighting bulls in the arena with market as a Gladiator. App Annie’s data insight (Android vs.iOS) gives a peek into the breakdown of revenues, downloads between platforms and countries with China, Japan and South Korea grabbing the eyeballs.
Downloads:
It is definitely a huge achievement when the downloads are doubled. In 2015 Google Play saw 100 percent more downloads than Apple’s App Store. It was 60 percent in 2014 meaning Google Play was not only a big player but also a fast growing one in 2015 than Apple’s App Store. This estimated report shows some fascinating numbers focused on comparing and contrasting two biggest app stores on global scale. All said and done when it comes to app store downloads Google Play is number one. However, this gap continues widening more and more with first and second best. Below are some key highlights of Download App Annie 2015 report retrospective to discover all of the important relevant changes that happened throughout 2015. These trends will impact app strategy for 2016:
Despite device penetration soaring, emerging markets showed impressive download and revenue growth in countries like Indonesia, India, Turkey, Mexico and Vietnam. Consistent demand for music, video and dating apps in 2015, IAPs share of app store revenue grew continuously. Result, incredible gains were observed in subscription revenue. There was a striking impact on app publishers’(portfolio management strategy) due to two very relevant developments in mobile games continuing to evolve in 2015:
- Average life cycle shortened year over year
- Revenue became less concentrated.
- Publishers were given new opportunities with Wearables and TV emerging as key platforms for apps. A challenging space to watch out in the coming years.
App Annie 2015 Retrospective — Monetization Opens New Frontiers:
In terms of monetization, Apple’s App Store made over 75 percent more in revenue than Google Play (2015). It is once again proved that Google Play is bigger than Apple’s App Store. It was also observed that iOS developers and Apple with its cut tentatively make more than Android developers and Google.
App Ecosystem:
For the App Ecosystem, 2015 was productive. Eventually, for video streaming, music streaming and dating apps, subscription monetization proved extremely successful. Asian markets such as India and Japan- games, ride sharing and m-commerce grew progressively with respect to downloads and usage. Not to miss mentioning, next frontier for apps of 2015-TV and wearables. The reason for worldwide iOS revenue surge (in part) was thanks to incredible gains in China, Japan and United States. China grew 20 %( from Q4 2014 to Q4 2015) as a remarkable iOS download contributor with revenue doubling year after year. Subsequently, Google Play had very impressive download share gains in US. It is said that share of Google Play and iOS downloads (combined together in 2015) surpassed iOS Apps Store. Hence, worldwide downloads of Google Play widen to somewhat 100% over iOS in 2015.

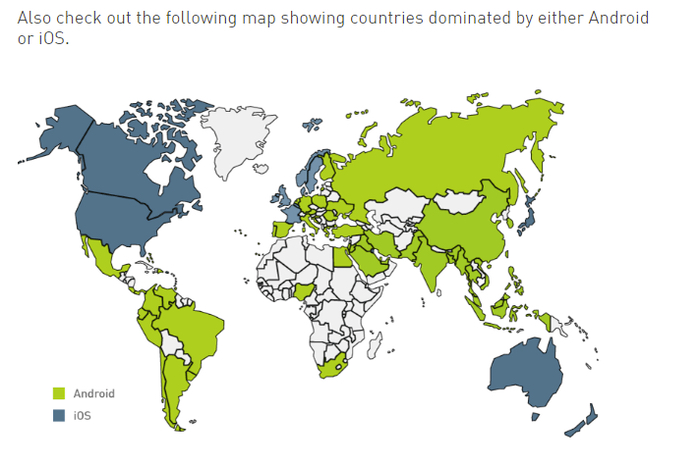
Android vs iOS market share in 2015:
Android devices sold better in 2015 and therefore gained more market share amongst most countries. As per latest stats by Kantar World panel in Q3 2015 - iOS alone had 29.2% market share in the USA. Whereas Android’s share was 65.9% - over twice. Whereas surprisingly in the EU5 countries the difference between Android and iOS was stated as 14.4% with iOS and 74% with Android. However it is difficult to find stats on sales of different mobile operating system. But it is always exciting to check out what is on offer. It is difficult ignoring to purchase a phone that is either not an iPhone or an Android-based device. Simultaneously, it is easy to locate Windows Phone-based models. These are available with offers limited to low end phones (except for Lumia 950 and 950XL). It is easy getting various OS viz. Firefox OS, Sailfish, Ubuntu, or Tizen. However, some countries need searching them through some extensive and exclusive online stores or auctions.
Browsing Stats: Based on Android vs iOS:
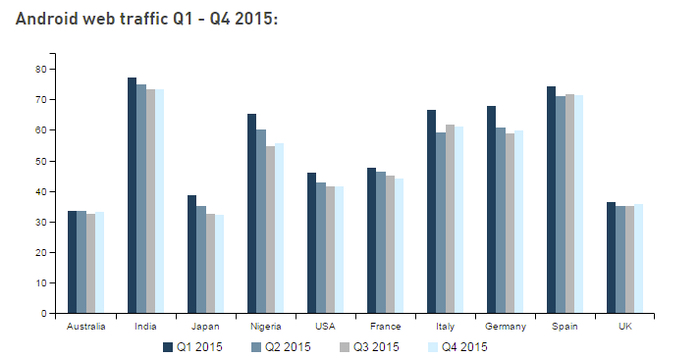
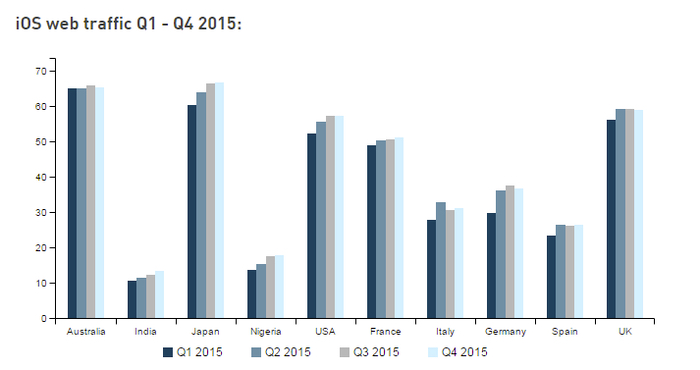
Since Users of different operating systems have various individual browsing habits, shipment statistics may not reflect actual device installed base data (because in many cases devices do not actually reach consumers). Statistics of device usage data show data about phone owners, using devices which are website hits based and not actual sales figures based. This is very well reflected in the graph as below:
App Annie analyzed that in entire 2015, iOS gained considerable amount of web traffic share in most countries. This was mainly attributed to various factors such as the growth of sales (general) or may be due to introduction of larger screen iPhones which obviously makes browsing on-the-go a very cosy and comfortable. It was thus observed and presumed that 4.7 and 5.5 inch iPhones owners browsed in good number than owners of 3.5 and 4 inch devices. Incidentally, it was also analyzed that the year 2015 was more disappointing for Android as compared to iOS. With USA and Germany Android lost considerable web traffic share which was not encouraging at all.
Assessment of Gains and losses:
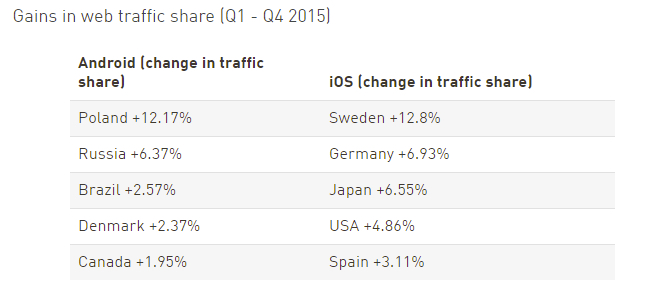
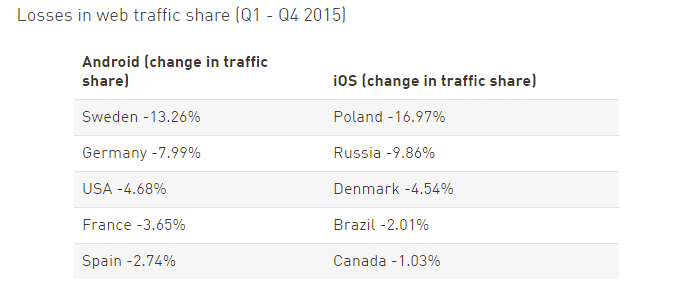
The year 2015 was considered as a “movers and shakers” market with iOS gaining more web traffic share than Android. Many countries therefore switched from Android to iOS. To name Singapore, Norway, Kuwait and Sweden respectively. Russia was the only country which did not make this switch from Android to iOS. However, there were also markets where Android showed a very encouraging leading position. The table below enumerates some selected markets where Android and iOS gained/lost web traffic:
Conclusion:
Hope the above research inputs have been successful in giving you a comparative analysis of the most usable mobile operating platforms in today’s time (with respect to downloads, revenues and breakdowns). It is more elaborately touched by this link in reference: https://www.goodfirms.co/resources/android-vs-ios-market-2015. All Graph images have been taken from deviceatlas.com