ANDROID Market vs. iOS Market - Mobile and Tablet Overview
Since the advent of iOS and Android since 2007 and 2008 respectively, both the operating systems have seen tremendous growth up till 2015. Because of which there has been a shift in the kind of mobile devices people use - from basic bulky mobile phones to metallic body smart phones to high-end phones offering sleek and lightweight body, QHD displays and biometric features. But above all this, the real change has occurred for BlackBerry and Windows phones which have literally become non-existent in the current times. So for most of us, the choice of which device to buy comes down to choose between Android and iOS.
The worldwide tablet market also shows interesting stints. Their importance in current times cannot be understated especially where they play a role of laptop but obviously a mini version. In the following sections, we take a deeper look at the year 2015 and present a snapshot of where did the top operating systems and top brands stand in comparison to each other.
GEOGRAPHICAL GATEWAY
By the end of 2015, Android came out as the undisputed winner in terms of sales across major countries. Except for Japan, the OS by the search giant occupied more than fifty percent of the market share. Even in countries like USA and UK, where Apple has always been a favourite among the masses, the inclination towards Android was clearly visible. Only Japan has the highest market share of iPhones in 2015. In Brazil, Android has a market monopoly with Windows OS coming second at 5%. The market share of Apple smart phones in this part of the world is the least in comparison to other countries.
Smartphone Operating System Sales Market Share (Dec-2015)
| Country | Australia | Brazil | China | France | Germany | Italy | Japan | Spain | Uk | USA |
|---|---|---|---|---|---|---|---|---|---|---|
| Android | 53.5% | 91.8% | 71.4% | 69.8% | 72.6% | 76.9% | 44.4% | 86.3% | 51.9% | 59.1% |
| iOS | 39.6% | 2.8% | 27.2% | 20.5% | 20.2% | 14.5% | 54.1% | 12.2% | 38.6% | 39.1% |
| Blackberry | 0.3% | 0% | 0% | 0.6% | 0.6% | 0.3% | 1.2% | 0% | 0.3% | 0.1% |
| Windows | 6.3% | 5.1% | 1.3% | 8.7% | 6.4% | 8.1% | 0% | 1.5% | 9.1% | 1.6% |
| Others | 0.3% | 0.3% | 0.2% | 0.4% | 0.2% | 0.2% | 0.3% | 0% | 0.1% | 0.1% |
Continued demand for affordable smart devices is the key factor people switch easily from their basic phones (limited feature phone) to new devices because of the small price gap. In the mobile phone operating system domain, Android offers a lot of options to choose from – which is one of the many reasons that it was the leader in terms of worldwide sales.
As per the sales figures at the end of Q4 2015, Android was the leading OS with 80.7% market share. It overtook iOS which came second with a market share of 17.7% but was nowhere close to the market leader. Windows held a market share of a little above 1% whereas Blackberry and other OS couldn’t even touch the 0.5% mark having negligible effect on the market. Windows mobile though have a small foothold in the global market, had a share of 2.5% in the first half which dropped to 1.1% by Dec, 2015.
From Fig.1, it is clear that since the commencement of 2015, the share of Android has increased up till Q3 with iOS being the second largest player offering its services globally. Though iPhone saw a constant decline in the first three quarters of the year, in Q4 the sales share increased to 17.7% from 13% in Q3.
MOBILE MANIA
For smart phones sales in 2015, Apple iPhone saw a Q-on-Q positive growth except for Q4 where it decreased by approximately 3% in comparison to 2014. iOS saw a sharp dip in global sales for Q2 and Q3, but called off 2015 with sales figures similar to Q1.
Also, the figures shows a similar decrease and increase for the cycle Q1-Q2 and Q3-Q4 respectively in both the years though the hold of Apple mobiles decreased for Q2-Q3, 2015 which was marginally strong for the same period in 2014.
Unlike iOS, the trend reversed for Android, where it saw increase in market share up until Sep, 2015 and sales dropped by 4% post September. Android closed the year at 1.8% higher in sales globally from where it was at the end of first quarter. Android wore the crown for having the highest market share for smart phone sales across the globe ahead of iOS. The giant share is because of the easy availability of Android smart phones across a range of different price brackets in emerging markets. iOS also ended the year on a positive note, thanks to the desire of Chinese population for phones with larger screens.
Android (2015)
| Android Version | Market Share |
|---|---|
| MARSHMELLOW | 1.2% |
| LOLLIPOP | 34.1% |
| KITKAT | 35.5% |
| JELLY BEAN | 23.9% |
| ICE CREAM SANDWICH | 2.5% |
| GINGERBREAD | 2.8% |
| TOTAL | 100% |
iOS (2015)
| iOS Version | Market Share |
|---|---|
| 9X | 77.8% |
| 8X | 11.9% |
| 7X | 9.2% |
| 6X | 1% |
| 5X | 0.1% |
| 4X | 0% |
| TOTAL | 100% |
With the release of iOS 9 in September last year, Apple offered its users with refined features, improved functionality and better performance. The last quarter of the year saw major software updates and by the end, nearly 77% of the iOS devices were running on the latest version provided by the company. Android’s MarshMellow which was also launched a month later does not narrate a similar story. Having only 1.2% of devices running on its latest version by the year end is an indicator of the cumbersome and slow upgrade process. Unlike iOS, users snuggled to the older versions of Lollipop and Kitkat contributing to 70% of the active devices. Android smartphone makers and even the wireless carriers test each device with every new version from Google before rolling it out to the users which means consumers have to wait for weeks or even months for the latest version.
Active Devices for Android Top Models
| MODEL | DEC 2014 | DEC 2015 |
|---|---|---|
| Galaxy S5 | 9.3% | 8.8% |
| Galaxy S3 | 10.7% | 8.5% |
| Galaxy S4 | 12.6% | 7.2% |
| Galaxy S4 Mini | 2.8% | 4.2% |
| Galaxy Note 3 | 5.3% | 3.8% |
| Galaxy S3 Mini | 2.8% | 3.3% |
| Galaxy Note 2 | 3.2% | 3.1% |
| Galaxy Note 4 | 1.4% | 2.9% |
| Others | 53.9% | 58.2% |
| TOTAL | 100% | 100% |
Active Devices for iOS Top Models
| MODEL | DEC 2014 | DEC 2015 |
|---|---|---|
| iPhone 6s+ | NA | 3.5% |
| iPhone 6s | NA | 9.3% |
| iPhone 6+ | 5.7% | 11% |
| iPhone 6 | 15.2% | 31.3% |
| iPhone 5s | 27% | 18.5% |
| iPhone 5c | 8.6% | 6.4% |
| iPhone 5 | 19% | 9.3% |
| iPhone 4s | 15% | 6.4% |
| iPhone 4 | 9.5% | 4.3% |
| TOTAL | 100% | 100% |
A look at above tables shows the top active mobile devices for iOS and Android. With the launch of iPhone’s new models 6s and 6s+ last year, there has been a sudden decrease in the current active state of older models especially the 4 and 4s series. Though the share of new models is 13% all together, it’s interesting to observe the increase in the share of iPhone 6 which stands at 31.3%, a little above of where it was in 2014. In contrast to the iOS industry, the Android landscape is much more fragmented, with dozens of manufacturers and thousands of devices – Samsung being the leader in the domain. Samsung, the greatest mobile vendor for Android OS saw a dip in the number of active devices for all of the top models it offers. Except for minor boost in the market share for Galaxy S4 mini, Galaxy S3 mini and Galaxy Note 4 no other genre of mobile phones by Samsung saw a rise.
The price of owning a smartphone could be high. Google’s prodigy of offering these devices across all price ranges makes it a hit mainly in the developing geographies which also reflects the kind of worldwide market share it holds. Over the years, there has been drastic decrease in the average selling price of Android devices, falling by 31.5% in 2015 as compared to 2012. But for iOS, the picture is fluctuating – decreased by 5.2% in 2013, up by just 1% in 2014 and settling again at a high of 2.1% by 2015. The average reduction in the price of an Apple smart hone was only 2.2% in last 3 years as compared to Android where the figure was fifteen times.
The smart phones market reached a gigantic figure by selling 1.42 Billion smart devices in 2015. The first half of the year remained slow with sales figures standing at 336 million and 330 million in Q1 and Q2 respectively. The market saw a sudden elevation when it closed its third quarter at 353 million units. With the launch of new mobile devices by Apple – iPhone 6s and iPhone 6s Plus in the last week of Q3, the fans gained momentum and the sales of smart devices reached its peak. This was one of the major factors that contributed to the increase in the market share this year.
VENDOR VENGEANCE
The last quarter of 2015 was merrier for Apple with the launch of new model and iPhone fans made the most of the holiday season. Though Samsung saw a dip in sales during the same period, it closed the year some points low at 30.9% which was 32.2% in January. Almost all the vendors saw a similar trend across 2015 where they lost a small portion of market share to other competitors. Only Huawei had a marginal increase in its market share and reached 2.4% from 1.6% at the beginning of the year.
Talking about the top two vendors in the mobile category, again Apple and Samsung stand out. Samsung remained the mass favourite globally and emerged leader across all quarters in 2015. Though it saw a decrease in market share but nothing that should make the leader worried about. The image though is not great for Apple, its market share reduced considerably throughout the year. Though the new launches improved the overall sales of smart phones globally, it did not serve the self-purpose very well.
Taking a look at the top mobile vendors, Huawei which was the only in the category to see a minor increase in its share by the year end comes at the third spot after Samsung and Apple respectively.
The Fig.8 indicates the quarter wise sales of smart phones to consumers highlighting the same trend that Samsung and Apple are the leaders in the mobile category.
TABLET TUSSLE
In the tablet landscape, Apple and Samsung came out to be the major players. The tablet market saw a decrease of 10% in the number of devices sold in 2015 in comparison to 2014. Of all the major vendors only Huawei doubled its tablet market share. Lenovo stayed where it was last year maintaining a stable head in the competition. For all others, the year did not bring in any good news.
A look at the tablet vendors give a clear picture that the market is ruled by Apple and Samsung. The gap between the two is far from lessening in the future. Apple is the king of the tablet landscape maintaining its lion’s share month after month.
Though, most of the market share of tablet industry is dominated by iOS variants; still the company makes some regular upgrades for the existing products. However, for companies that rely completely on Android based tablets the future looks shady. The usage of tablets will reduce drastically unless the service providers and vendors come out with something as good that is enough to replace either of the existing smart phones, phablets or laptops.
Other tablet vendors shown in Fig.11, especially Google and Asus have given each other a tough fight throughout the year to fight for the fourth slot in the tab market, not much far behind Amazon who enjoys the third spot. Though the struggle between them is tight, none of these including Samsung would be in the league to fight head to head with Apple. It is said to enjoy the monopoly for years to come.
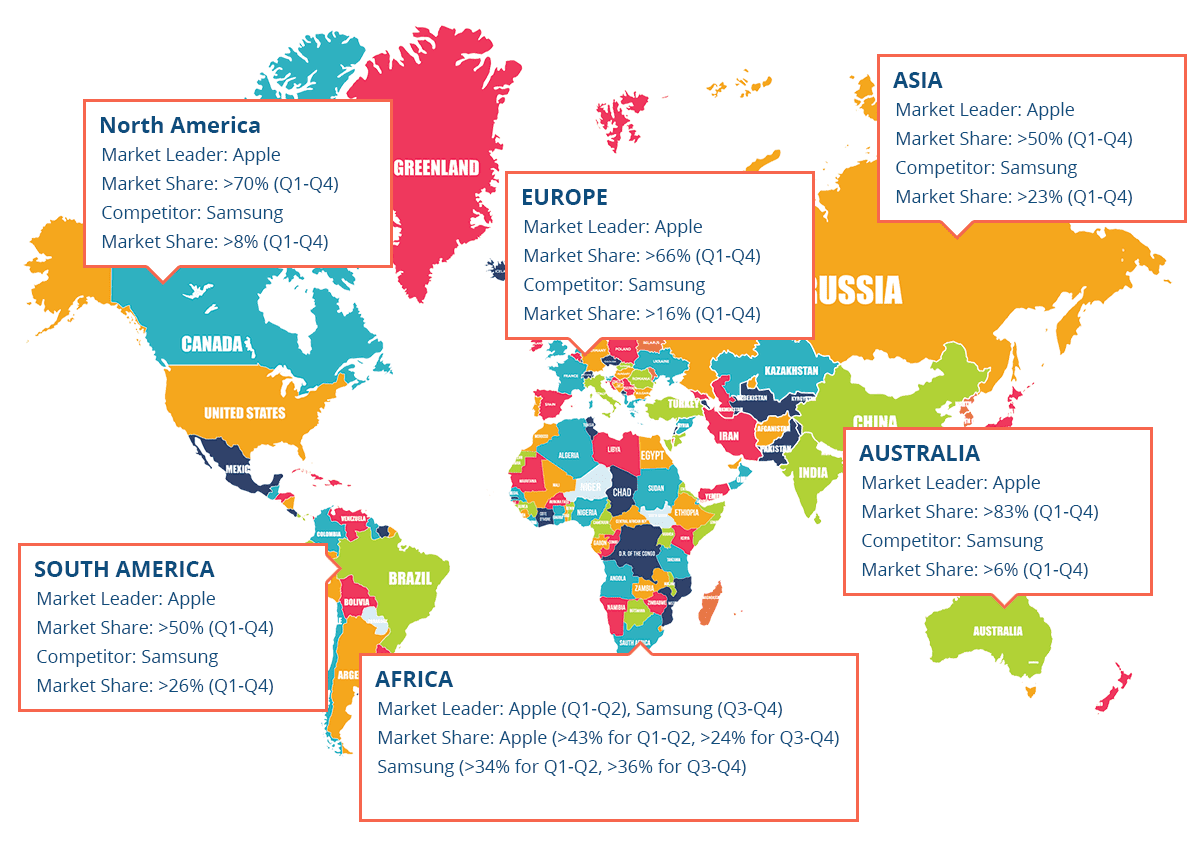
Fig.12 - Market Share of Tablet Vendors (2015)
Fig.12 shows a global lookout of the tab vendors across geographies. In North America and Australia though Samsung is the biggest competition to Apple tablets, still its market share is less than 10% in both the geographies. A long journey awaits Samsung to reach the peak in these areas. In Europe, Asia and South America, Apple remains the leader but it’s not far for Samsung to give it a neck to neck competition for the top slot. The situation in Africa is worth noticing – the first half of the year was dominated by Apple with a market share above 43% but in the latter half fell below 40% surrendering the top slot to Samsung.
KEY FINDINGS
- Android playfield is dominated by Samsung both for mobiles and tablets. Other players in the landscape have a long way to go before then enjoy laurels similar to Samsung.
- 2015 proved to be good year in terms of numbers. The year ended with a total sales of 1.42 billion smart phones, 14.3% higher than 2014.
- The mobile phone market share of Apple has reduced drastically. It bore a loss of 4% over the period of 12 months.
- The year on year decrease in the sale of the tablets calls out for some new innovations. Though Apple leads the industry but saw more than 20% year-over-year decline in tablet shipments.