DWH design and architecture. BIOS create the convenient reports for our team
What was the project name that you have worked with BIOS. Power BI development?
OnHires’ financial reports from BIOS
What service was provided as part of the project?
Big Data & BI
Describe your project in brief
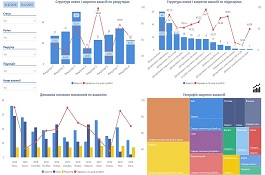
Our financial reports needed additional analytics - projects, articles, marketing's sources and so on. For this it was necessary to finalize the data warehouse and develop reports with additional analytics. BIOS identified 1 developer who conducted a business analysis of our requirements, made changes to our storage and developed reports, trained employees. They upgraded analytical financial statements of the existing system - P&L, Cashflow.
What is it about the company that you appreciate the most?
The quality of the agency's work. All the additional KPI in our financial reports we needed BIOS developed on time.
We communicate almost every day on Microsoft Teams, and every week by email for reports.
What was it about the company that you didn't like which they should do better?
I am satisfied with their work. It was really good cooperation.
Rating Breakdown
- Quality
- Schedule & Timing
- Communication
- Overall Rating
Project Detail
- $0 to $10000
- Completed