Leading Data Solutions & Consulting Company

GetOnData Solutions is a leading data consulting and solutions provider specializing in data science, business intelligence, and data engineering. We offer comprehensive services, including data strategy consulting, advanced analytics, and AI integration to optimize business processes and drive strategic growth. Discover GetOnData Solutions' expert data analytics and consulting services, designed to enhance business decision-making and efficiency.

United States United States
1207 Delaware Ave #1743, Wilmington, Delaware 19806
331 220 2070
$25 - $49/hr
10 - 49
2022

Service Focus

Focus of Big Data & BI
  • Data Visualization - 10%
  • Data Mining - 10%
  • Data Analytics - 10%
  • Data Science - 10%
  • Data Warehousing - 10%
  • Data Migration - 10%
  • Business Intelligence Consulting - 10%
  • Big Data - 10%
  • Data Engineering - 10%
  • Tableau - 10%
Focus of Artificial Intelligence
  • Machine Learning - 100%

Industry Focus

  • Financial & Payments - 20%
  • Healthcare & Medical - 20%
  • Transportation & Logistics - 20%
  • Retail - 20%
  • Insurance - 20%

Client Focus

60% Small Business
20% Large Business
20% Medium Business

Detailed Reviews of GetOnData

No Review
No reviews submitted yet.
Be the first one to review

Client Portfolio of GetOnData

Project Industry

  • Business Services - 50.0%
  • Transportation & Logistics - 50.0%

Major Industry Focus

Business Services

Project Cost

  • Not Disclosed - 100.0%

Common Project Cost

Not Disclosed

Project Timeline

  • Not Disclosed - 100.0%

Project Timeline

Not Disclosed

Clients: 1

  • USA and Australia

Portfolios: 2

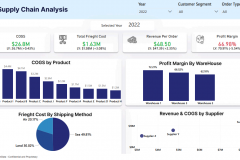
Smart Supply Chain Dashboard – Turning Logistics Complexity into Clarity

Smart Supply Chain Dashboard – Turning Logistics Complexity into Clarity

  • Smart Supply Chain Dashboard – Turning Logistics Complexity into Clarity screenshot 1
  • Smart Supply Chain Dashboard – Turning Logistics Complexity into Clarity screenshot 2
  • Smart Supply Chain Dashboard – Turning Logistics Complexity into Clarity screenshot 3
Not Disclosed
Not Disclosed
Business Services

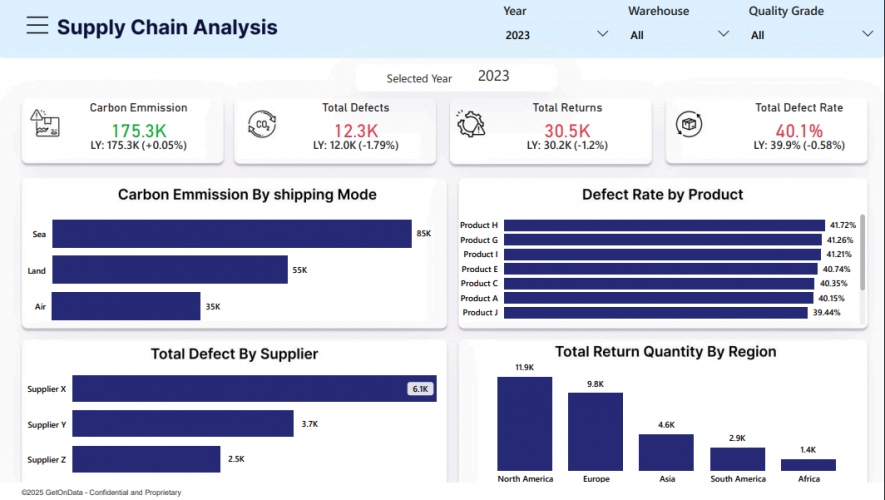
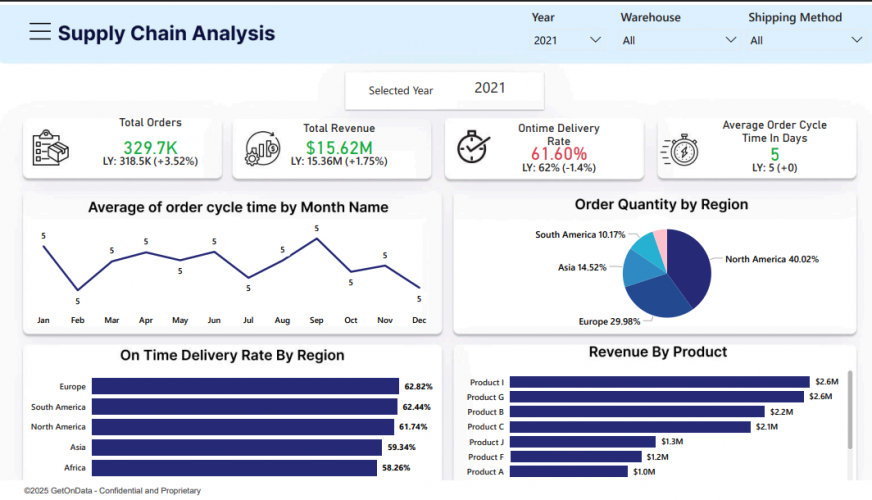
Supply chains are only as strong as the visibility behind them. This Smart Supply Chain Dashboard, built by GetOnData, transforms fragmented data into a clear, actionable view of performance—spanning orders, revenue, delivery timelines, and regional trends.

Tailored for fast-paced logistics and e-commerce ecosystems, the dashboard enables:

Real-time order monitoring across global regions
Granular tracking of delivery KPIs like on-time percentage and cycle times
Comparative revenue insights by product category and geography
Seasonal or monthly trend analysis to support better forecasting

Key Capabilities:
Built-in filters for warehouse, year, and shipping method
Delivery performance visualization by region and month
Live revenue and order metrics updated via API pipelines

Use Case Impact:
Reduced manual reporting by 80%, improved cross-border delivery planning, and enabled proactive inventory adjustments across warehouses.

 Transforming Warehouse Management With Data Analytics

Transforming Warehouse Management With Data Analytics

  •  Transforming Warehouse Management With Data Analytics screenshot 1
Not Disclosed
Not Disclosed
Transportation & Logistics

Objective:

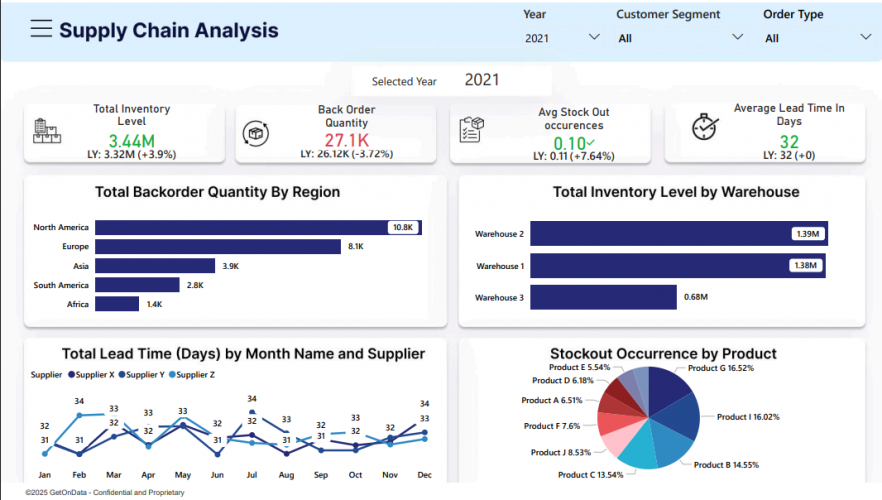
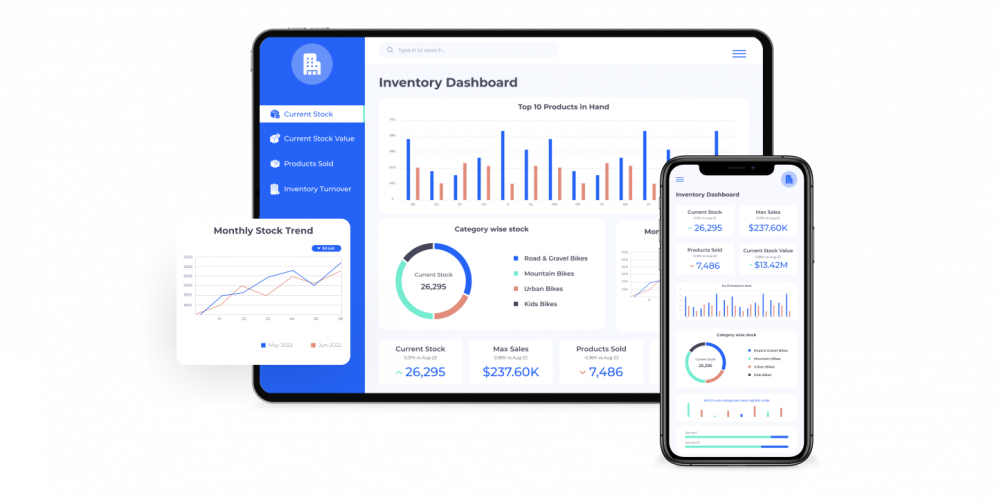
Our client has a complex supply chain that includes multiple warehouses and distribution centers. GetOnData investigates the implementation of inventory Analytics in a warehouse. The analysis utilizes a comprehensive dashboard created in Tableau, which provides valuable insights into inventory levels, demand patterns, and stock movement. By leveraging data-driven decision-making, the company was able to optimize inventory management, improve operational efficiency, and reduce costs.

The Challenges:

  • Struggling To Keep Track Of Its Inventory Levels
  • Inventory Calculation On Top Product Turnover
  • Facing The Forecasting On Historical Inventory Data
  • Difficulty In Managing Current Stock And Values

The Solutions:

The dashboard provides real-time visibility into inventory levels, and it helps the company to identify and address potential problems before they impact customer service. The inventory management dashboard included various metrics and visualizations, including:

Inventory Turnover:
Calculation of inventory turnover ratio to assess how quickly products are moving through the warehouse.

managing current stock:
Stockout Analysis
Identification of stockouts and the associated impact on sales and customer satisfaction.

Inventory Data:
Demand Forecasting
Forecasting future demand based on historical sales data and market trends, facilitating proactive inventory replenishment.


Stock Movement Analysis
Visualization of stock movement patterns, including inbound and outbound shipments, transfers, and returns.


Supplier Performance
Evaluation of supplier performance based on metrics such as delivery accuracy and lead time.