A dashboard is an invaluable all-in-one tool that can track, analyze, and display pertinent information to help improve the proficiency of specific areas of any business. Its purpose is to extract data from various sources to provide a visual representation in real-time. When properly utilized, dashboards can help make decisions on the fly, and completely impact the business in many ways. Almost any business can benefit from a dashboard that matches the company’s objectives. Access to data at-a-glance is a genuine game-changer.
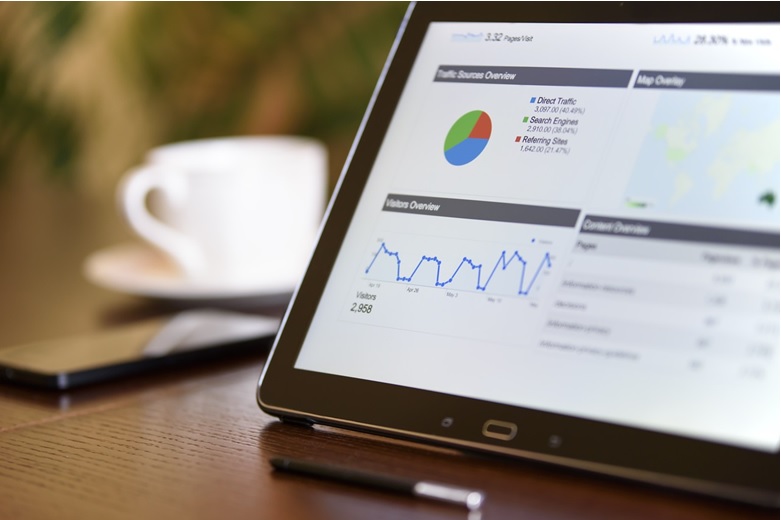
Well-designed dashboard software can help you make an informed decision.
Do You Need a Dashboard Design?
If you are not clear about the purpose of a dashboard, ask yourself these questions:
- Is there room for improvement within your company? Or has it reached the pinnacle you had planned?
- Do you know how to get the most out of your current data information system? Do you have a data information system?
- Is your business providing the level of profitability it needs? Or is it constantly lagging behind?
- Is your business a leader in its industry? Or is it constantly trailing behind its competitors?
- Do you have a means for viewing all pertinent data at one time to get an overview as well as the individual departmental details? Or are you constantly having to view several reports?
There are several metrics that can be included in a dashboard design. A few of the most common benefits and reasons for incorporating a custom-developed dashboard are:
- Immediate Data Availability: Getting information a day late can be costly. Data that is available 24/7, easily understood, and utilized is the on-demand information that can be of use for an advertising campaign, website, and so much more.
- Accountability: The days of guesswork are over. With a custom-designed dashboard, you will have up-to-the-minute information that will isolate weak or troubled areas that can be changed or fixed more quickly. When each department has access to the dashboard, response time and responsibility will both exceed past activities.
- Interactivity: Static information is helpful, but when the dashboard is interactive it can be indispensable. Users can expand the metrics to view specific details and filter the data to be more functional.
The bottom line is dashboards that are customized allow users to make better decisions based on hard facts and metrics. When the appropriate parties are monitoring pertinent metrics daily, they will be armed with information and details that will further each departments’ goals.
What Problems Would You Like to Solve?
Once you identify the specific problems you would like to solve, you can determine which type of dashboard you will need. Are you interested in:
- Current performance related to Key Performance Indicators (KPI) to ensure performance is on target in real-time.
- Reviewing historical data that can help predict future or provide insights upon which the business model can be revised or completely overhauled.
- Monitoring long-term company goals and strategies by including critical success factors.
- Analyzing and monitoring processes, such as those supervised by mid-level management.
Isolate the issues that will bring your company closer to meeting its goals and mission before developing a customized dashboard. It may need to be tweaked periodically, however, start off with the most comprehensive dashboard by thinking about the issues in advance.
3 Main Types of Dashboards
Depending on the data you wish to retrieve on a frequent basis, you may need an operational, analytical or strategic dashboard. Dashboards tend to fall into one of the three categories of how they are used. Some companies use all three types, while others only require the use of one or two.
1. Operational Dashboards
If you are thinking about developing a dashboard that includes real-time performance data that displays the activities of the day, it is likely you will want an operational dashboard. It will provide a comprehensive picture of the various elements you will want to capture at-a-glance.
It is important to keep the end-user in mind when developing an operational dashboard, as it needs to be functional and understandable. The scope should not be too broad or too narrow and should include only the data that provides a complete and comprehensible picture. It is judicious to involve the end-user(s) in the dashboard development process so it can be designed to display what they need to improve their job performance.
2. Analytical Dashboards
An analytical dashboard contains large amounts of data that can be analyzed and distilled to support executives. Although middle management may use the dashboard on a daily basis, its primary purpose is to document trends and other variables so that more prudent decisions can be made.
For example, a financial dashboard may hone in on how the company’s working capital is being used. A benchmark can be established and future goals set based on the analysis of the data.
3. Strategic Dashboards
A strategic dashboard provides reporting tools that monitor the company’s long-term strategy against predetermined critical success factors. These types of dashboards track performance metrics against the company’s strategic goals. They are usually used by the company’s higher echelons to determine if it is staying on track or whether it needs to deviate or revise its overall strategy.
An example of a strategic dashboard might be a management dashboard that could be used for an executive or board meeting. The metrics are generally around revenue, growth, competitors, and the like.
Best Practice Guidelines for Dashboard Design
Every business could benefit from a well-designed dashboard that provides data and information at-a-glance. Viewing trends and changes in the industry against the company’s metrics can be incredibly satisfying and productive, however, there are a few dashboard design guidelines you will want to keep in mind.
- What is the purpose of the dashboard? As mentioned earlier, spend time talking to the end-users to ensure the design includes every element that will help paint the picture they need to monitor.
- Data representation should be easily understood. Choosing the wrong type of chart, or displaying information that makes little sense can actually do more damage than good. Or it could end up being a dashboard that doesn’t get used.
- Use consistent formatting and abbreviate long values to keep it simple. At-a-glance is the name of the dashboard game. Although analysis will take time, reviewing the dashboard should not. Consistency in information placement, layout and flow are important to usage. Prioritize the information so it can be placed based on the hierarchy of the page.
- Use building blocks and consistent structure. The grid is designed based on the number of widgets necessary to include the charts, controls, and data. “Cards” are easy to manipulate and rearrange, so they make great design tools.
- White space is important. Do not overcrowd your dashboard. Have each metric stand out from the others by using white space around each one. Also, make sure the font(s) being used are easy-to-read at various distances.
- Personalize and customize. Functional and effective dashboards include content, experience, and other aspects that the user(s) can embrace. That which matters to them should be included in the dashboard design.
- Data tables and/or lists must be integrated properly. Having data tables that are properly formatted and integrated is necessary, as well as making sure they are interactive. Most analytical users are accustomed to using spreadsheets and data tables, so following that type of design will be easy-to-read and quickly understood.
- The final dashboard design comes last. Determining the components, formatting, layout, and design elements are all areas that should be chosen prior to designing the actual dashboard. You may decide to eliminate or add components once you see all of the pieces in one place, so don’t be hasty in completing the dashboard until you feel confident that everything has been considered.
Are Dashboards Crucial to the Business Intelligence Process?
Of course, they are crucial. When key performance indicators are available in real-time, the business can analyze and visualize information on a whole new level. When using a business intelligence dashboard design, the users can see the big picture as well as the individual components. Both instant and long-term insights can be gleaned and analyzed for evolutionary changes that need to take place now and in the future.
Conclusion
The best dashboard designs quickly catch our attention. With the availability of dashboard software, companies have the opportunity to fine-tune nearly every aspect of their online presence. Datapine, Slemma, ClicData, and iDashboards, are a few listed by Goodfirms. Changes that spring forth from dashboards can help companies evolve, refine their business model, expand their offerings, better understand their target audience along with purchasing habits, and so much more. If you have a budget constraint or would like to have the freedom to use the software, then you should opt for free and open-source dashboard design software.
In the past, retailers and manufacturers had to rely on sales and reports that were provided weeks or months after-the-fact, which did not allow for timely changes and decisions to be made.
Dashboard usage is becoming one of the most important business tools a company can utilize. It truly can make the difference between success and failure, particularly for businesses that have spotty cash flow, low market share, and inconsistent profitability. Plus, once the dashboard is designed and utilized it will rarely require further attention or expense.
Share your views here if you have used any dashboard design software.