For every organization in this digital age, the volume and value of the data are rising very frequently. It is becoming challenging for the businesses to compare real time and historical data for getting more value out of it. Not only this, they are also facing issues in getting a balanced perspective of their business and aggregating essential business metrics at a single place. To prevent such issues, businesses can opt for dashboard software that serves as an essential tool to monitor and control the different metrics within an organization in real-time. A dashboard software acts as an indispensable tool to improve decision-making, business performance and make more profits.
A dashboard software stands as a centralized platform where businesses can gain an accurate and deep understanding of the data in a simple graphic interface. To gain in-depth knowledge on the same, let’s understand everything about Dashboard software with a special note on the free and open source Dashboard software solutions.
What is a Dashboard?
A dashboard is a panel that presents all management KPIs (key performance indicators) and critical data points at a single place that helps in monitoring the health of the business or department. The dashboard simplifies the complex data sets by making use of data visualization, which in turn helps users to gain awareness of the current performance at a glance. The user can visualize data in the form of charts, graphs, or maps to get the most out of it.
The dashboard becomes tremendously valuable for planned decision-making. The dashboard system helps in turning data into actionable insights and reports that you will find it easy to read. Today, dashboards are a proven system for businesses as it helps them to consume the big data clearly so as to make fact-based decisions. Business users need not rely on their mere gut instincts!
It would be great to use dashboard software to make out how well the marketing plan and business project is performing. Let’s discuss dashboard software in detail.
What is Dashboard Software?
Dashboard software works as a computerized graphical user interface that simplifies complex data sets and helps in revealing the patterns of the data processing. It allows users to monitor, analyze, visualize and aggregate data to comprehensively view business performance at a glance.
You can make use of this technology in various types of business processes such as marketing, human resource, sales, and production to instantly gain actionable insights into them.
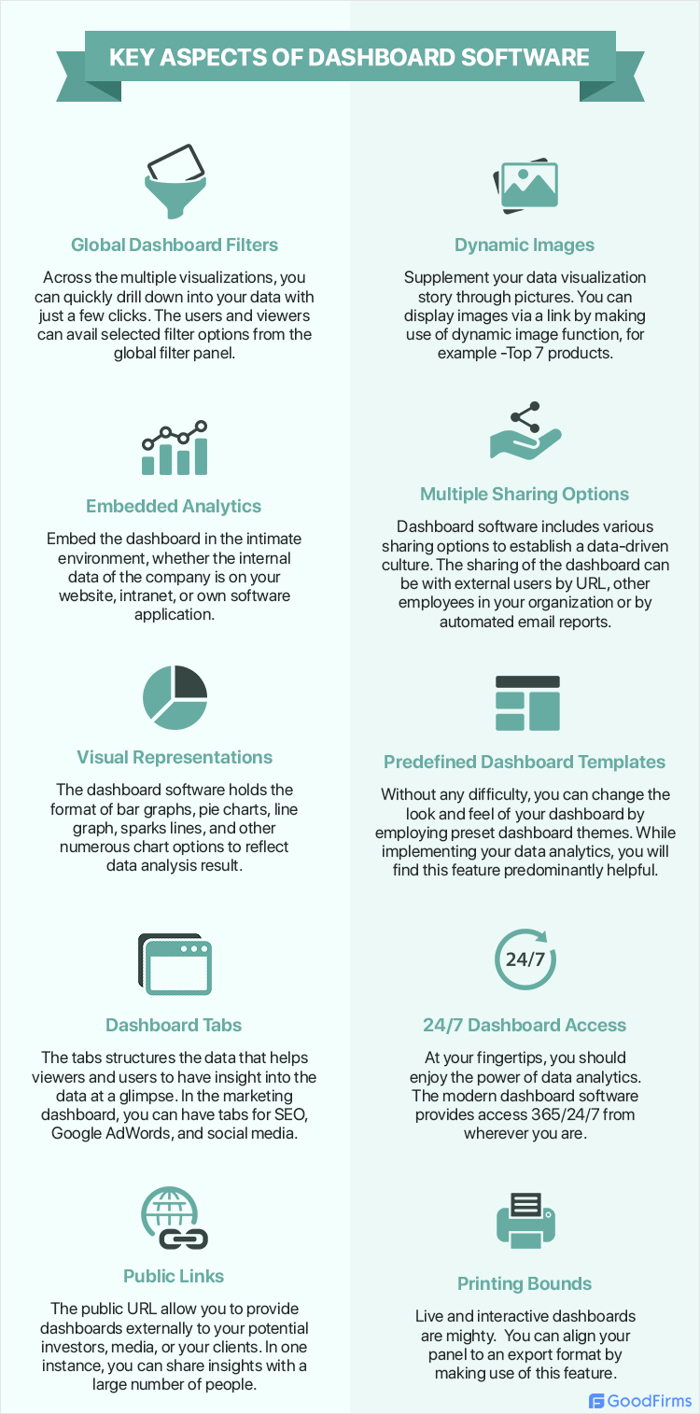
What are the key aspects of dashboard software?
Make sure that your dashboard software has all the necessary dashboard features for your business so that you can get the most out of your data.
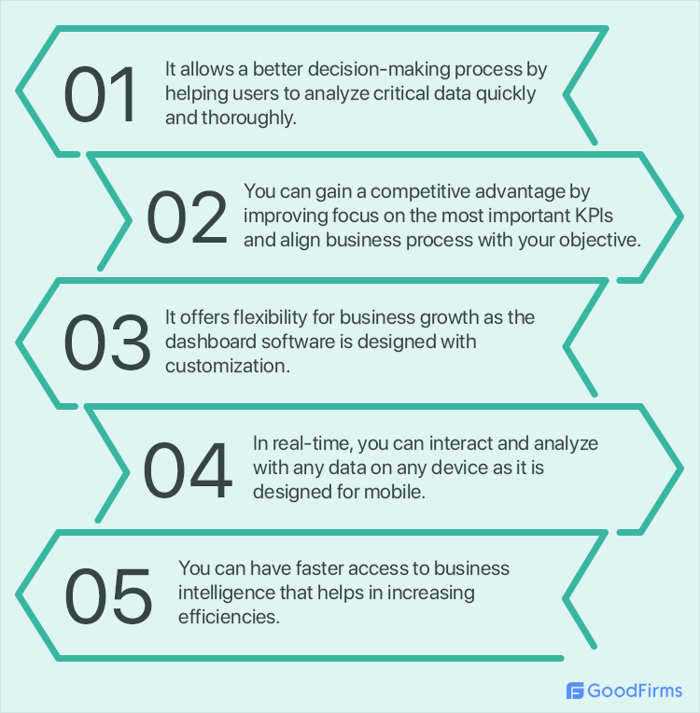
What are the benefits of dashboard software?
The users can access, interact, and analyze up-to-date information at a centralized location through dashboard management software. The advantages of using this technology are as follows:
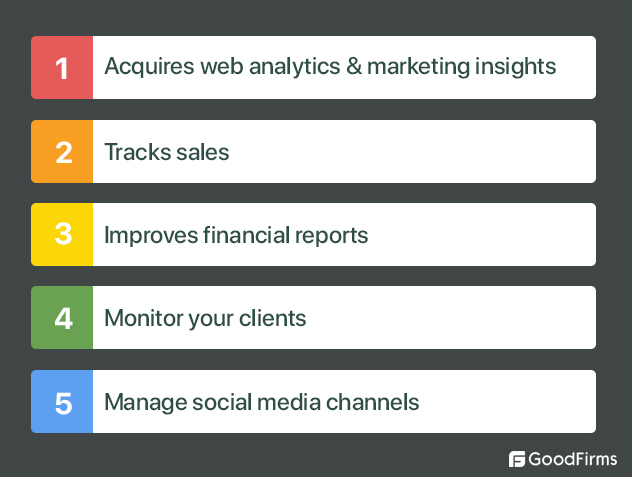
Where can you use dashboard software?
You can use dashboard software in various industries to transform your data into actionable business intelligence.
Finance, Marketing, Customer service, healthcare, human resource, sales, manufacturing, retail/eCommerce, IT, education, computer software, government & city, energy, performance, supply chain, executive, telecom & media, travel & hospitality, SaaS, Project management and social responsibility.
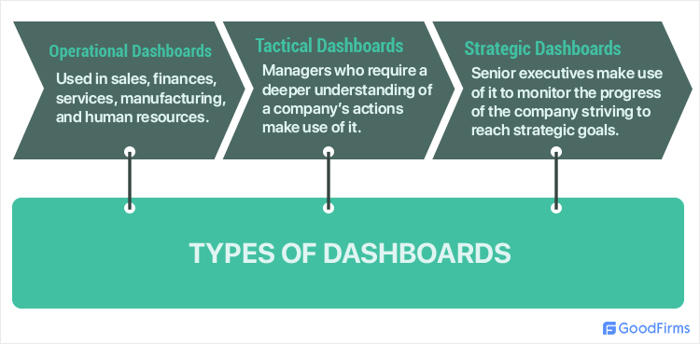
Types of dashboards
In three general categories, dashboards can be divided into operational, tactical, and strategic, depending on where they are used:
What is the significance of the business dashboard?
Currently, in the market, you can find different types of dashboard software solutions. Some are apt for large enterprises while some are meant for small-scale businesses. If the budget doesn't allow you, there is also the option of a free and open-source dashboard tool that provides high-quality options free of cost.
In your business operations, you can make use of free and open-source dashboard software to get an overview of your company’s performance.
You can easily analyze the different facets of your business operations by customizing the data of your company with the help of free dashboard software.
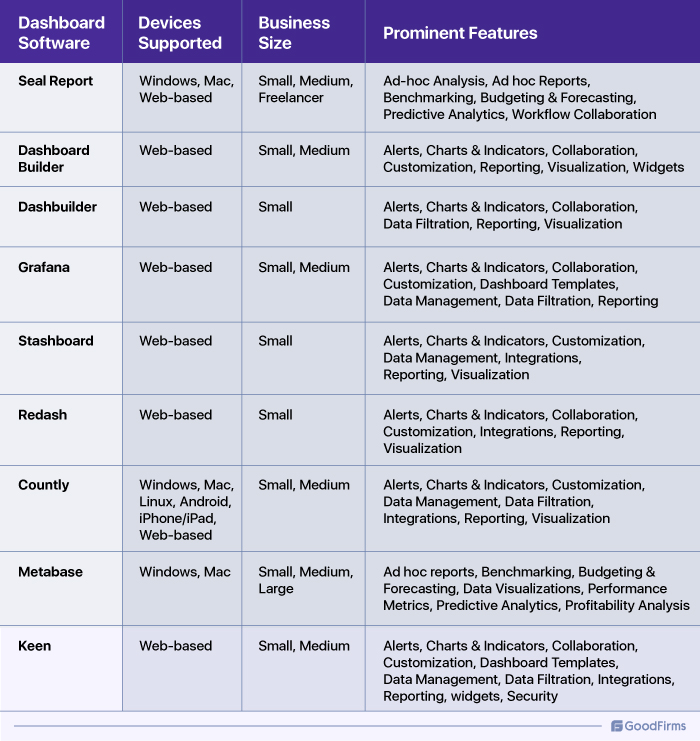
Comparison Chart of Dashboard Software
Free and open-source dashboard software
1. Seal Report
SealReport is the free and open source dashboard software that offers a framework for producing daily reports. With minimal ongoing maintenance, you can create dashboards from any database.
This software holds limited business intelligence functionalities. The focus of this free dashboard software is easy installation and report design. Once the software is setup, then in a minute the reports can be built and published.
The Seal Report helps in creating, editing, and executing reports through its Report Server feature. The Server Manager in this software carries out the administrative tasks. The end-user can edit and run the dashboard by using Web Report Server.

(Source: Seal Report)
Highlights:
- Task Scheduler schedule report executions
- Dynamic SQL to query the database
- Report tasks perform batch operations
- Low TCO (total cost of ownership)
- HTML 5 Charts defines and display chart series
- Drill-down navigation to navigate your report
- Report publishing using Web Reporter Server
- On the web, Web Reporter Server publish your reports
- Dashboard View shows your KPIs
- Native Pivot Tables drag & drop elements
- Razor engine parsing
- Join and query data sources using LINQ queries
Dashboard Builder is another easy-to-set-up free and open-source dashboard software to summarize and display your business data in a compelling and secure manner. It offers robust functionalities and a user-friendly interface to simplify data querying and visualization, construct database queries, create relationships between tables, etc., without any coding and SQL knowledge.
It comes in online, desktop and on-premises versions that can be easily aligned with different PCs, tablets, and mobile phones. Dashboard Builder is mainly used by companies to build executive, business, sales and supply chain dashboards. It can easily fetch data from multiple sources including MySQL, MS SQL, CSV, MS Excel, Google Sheets, etc., to instantly provide real-time insights.
It also offers customization features to easily group, summarize and display the charts in each layout. Other major features of Dashboard Builder include machine learning powered predictive analytics capabilities and seamless integration with any PHP application to ensure accurate demand forecasting.

(Source: Dashboard Builder)
Highlights:
- Drag & drop functionalities
- Advanced dashboard filtering
- Dashboard query builder
- Multi-language support
- Dashboard user and access management
- In-built themes
- PHP-based 3D chart builder
- MySQL Pivot table
- WordPress plugin and Joomla extension
- Extensive chart library
- Real-time data streaming and updates
- Dashboard sharing with the public and other users
3. Dashbuilder
The non-technical user can visually create business dashboards by making use of this free dashboard tool. From heterogeneous sources of information like regular text files, you can extract dashboard data. This full-featured web application is based on Uberfire.
The new version of this software is UF Dashbuilder that holds more features and an amazing user interface.
For building business dashboards and reports, this software is an open-source platform. The target users of this tool can be managers or business owners who regulary deal with dashboards and reports.

(Source:Dashbuilder)
Highlights:
- Prepared for deployment
- Drag’n’ drop offers visual configuration
- Aligned creation and editing of KPIs
- Interactive report tablets
- Fine-grained access
- Customization allows look’n’feel modification
- Import & Export, data can be exported to Excel
- Customization allows look’n’feel
- Import & Export, data is exported to Excel
- Connectors & standard protocols
- Integrates with business process management (BPM) platform
- DashBuilder Authoring to author dashboards
- SQL DataSource configuration using system properties
- Download and run Dashbuilder binaries locally
- SSE (Server-Sent Event) in Dev mode
- Client to server communication using REST
4 Grafana
Grafana serves as the open-source dashboard framework for great analytics and monitoring. With this free dashboard software, the users can create dashboards with panels. Over a set time frame, this panel represents the specific metrics.
For any specific project or business need, you can customize the dashboard as it is versatile. This open-source app for analytics and monitoring works as a powerful tool for informed business decisions. It is flexible software that supports multiple data sources.
For all your metrics, this analytics platform allows you to query and visualize. You can foster a data-driven culture by creating, exploring, and sharing dashboards with your team members.
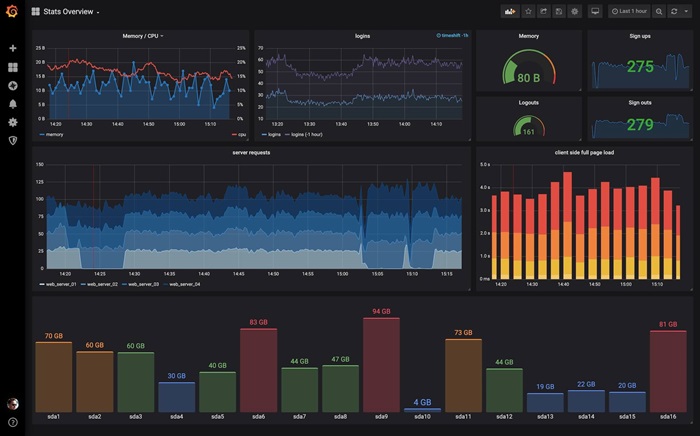
(Source: Grafana)
Highlights:
- Plethora of visualization options
- Seamlessly define alerts
- Unifies the data
- Backed by a vibrant community
- Official library
- Data-driven culture
- Collaborative
- Built-in graphite support
- Authentication
- Supports multi-tenancy
- User preferences
- Dynamic dashboards
- Explore metrics & logs
- Mixed data sources
- Ad-hoc filters
- Annotations
- Light theme
- Chat integration
Stashboard is the free and open source dashboard tool that works as a status dashboard for APIs and software services. In this app, you will find the similarity to the Amazon (AWS status page) or the Google (Apps Status Page).
For any hosted service or API, this software provides a generic status dashboard. You can download, customize, and run the code on any Google App engine account. This app is written in Python and hosted on Google App Engine.
Initially, this app was written by Twilio to provide status information on your phone, Communication APIs, and SMS. You can customize the look and icons to meet the branding.
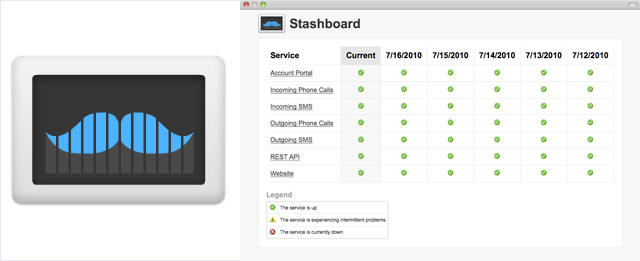
(Source:Stashboard)
Highlights:
- Custom status messages and icons
- Shows historical status
- Get and set information through REST API
- Track multiple different API or SaaS services
- Customization
- View current service status
6 Redash
Make sense of your data by making use of this free and open-source dashboard tool. You can connect and query your data sources and build dashboards that help you in visualizing data.
With the collaborative advantages of the cloud-based service, you can enjoy the power and comfort of SQL. You can query your data from different sources to answer complex questions with the help of SQL, Influential data, and API data sources. In a new and meaningful way, this app helps tens of thousands of users to query databases and visualize data. From small teams to large organizations, all are benefited from this app.
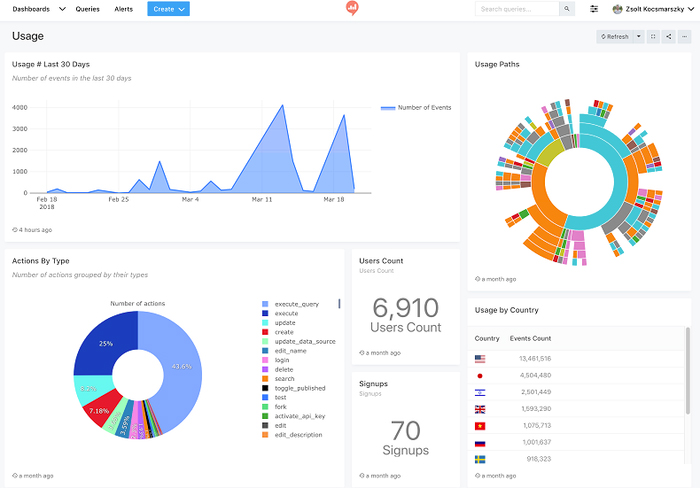
(Source:Redash)
Highlights:
- Customize and add features
- Query all the data
- Drag & drop
- Share dashboards
- Performance Metrics
- Scorecards & Ad Hoc reports
- Key performance indicators
- Reporting & Integrations
- Set up alerts and notifications
- Schedule auto-update
- Create and reuse snippets
- Share dashboards with colleagues, other teams or external partners
- User management with SSO and access control
7 Countly
If you are looking for secure and extensible product analytics, then you can rely on Countly open source dashboard software Countly Lite. To understand and enhance the customer journeys in web, desktop, and mobile applications, this tool is considered one of the best free and open source dashboard software.
Based on in-app behavior, this app sends triggered push notifications to your app users. Without updating the app, you can change the behavior and appearance of the application.
From video intelligence, you can monetize your mobile applications via high-quality video ads. In the cloud and on-premise, billions of data points are secured every day that help companies in growing their business across the globe.

(Source:Countly)
Highlights:
- Visualize metrics
- User retention analysis
- Remote Configuration
- Drill & Segmentation
- Ratings & Feedback
- Cohorts
- Rich push notifications
- Compliance hub
- Automated push
- Data Migration
- White Label
- Plugin Uploader
- Alerts & User groups
- Assistants & Flows
- Push Approver
- Filtering Rules
- Web Analytics & Attribution Analytics
- IoT Analytics
- Source Metrics
- Database Viewer
- A/B Testing
- Data populator and manager
- Jira integration
8 Metabase
For everyone in your company, this open-source dashboarding software is an easy way to ask questions and learn from data. By using this software, you will come to know what your company is learning about your data through a real-time glimpse. The users can move from their data to beautiful graphs and charts. If you require a little more power, then Metabase provides a graceful SQL.
This free dashboard software allows everyone in your team to create, share, and organize the collections of data. In this software, you will get new features, interface improvements, and can fix the bugs. Once you get the credentials to the database, then in less than 5 minutes, it is ready to build compelling data driven reports.
 (Source:Metabase)
Highlights:
- Filter and group the data
- See connections
- Visualize results
- SQL interface
- Open-source & constantly improving
- Free and simple to set up
- Activity & dashboards
- Sandboxing
- Supports CSV upload
- Caching
- Permissions and access control management
- (SOC 2 Type II and GDPR compliant
- Shared SQL snippets
9 Keen – Open Source and Free Trial
With minimal development time, this open-source software provides powerful in-product analytics. You can make shipping custom end-user analytics smooth and seamless with this customer-facing metrics platform.
The business intelligence professionals get data collection, data analysis, data visualization solutions from this web-based platform. From email analytics and growth analytics to product analytics, you get insights for all business requirements. The professionals can extract real-time performance measures, point out errors, and monitor response time with the help of Keen’s performance monitoring module. The analytics professionals can create, embed, and customize charts in dashboards, reports, and client-facing documents due to the data visualization feature in this software.
 (Source: Keen)
Highlights:
- Real-time analytics
- Role based access
- Custom SSL
- Events and queries usage
- Data explorer with no code
- Chargify Integration
- Customer-facing metrics
- Visual Analytics & API
- Compact dashboard app
- Enterprise-ready core framework
- Reusable component framework
- Full SaaS Support
- Charting & Data Filtering
- Data Visualization and third party integration
Apart from the above-mentioned free and open source dashboard software, there are many top-rated dashboard tools that needs a mention. Here, we have listed a few;
List of the Top Dashboard Software Commonly Used
Apart from the free and open source dashboard software, businesses are using many other premium tools to visualize their different critical metrics at a single place. These premium tools come equipped with the robust technologies, features and capabilities that enable data driven decision making for better business performance. Some of the popular among these premium dashboard software systems are as follows;
Tableau
Out of all the dashboard software available in the market, Tableau is a leading one that helps businesses easily view and understand their data. It is widely used by analysts, data scientists, students, teachers and business users owing to security, flexibility and end-to-end analytical capabilities. It comes with inbuilt Tableau AI to further improve the organizational decision-making and automation capabilities. Some globally renowned clients that use this tool include Verizon, Lenovo, Lufthansa, Honeywell, jetBlue, Bentley, etc. Besides a free trial, Tableau is available in Creator, Explorer, and Viewer pricing packages and further information can be acquired after consulting with the sales team.
Datapine
Datapine is another popular data visualization and dashboard tool that allows businesses to gain secure access to their data and make data-driven decisions. Management, finance, sales, marketing, HR, procurement and IT departments highly use this tool to leverage data to unlock their full growth potential. It comes with a drag-and-drop interface and interactive dashboard elements for real-time dashboards, custom SQL queries, cross-database queries, advanced user management, intelligent alarms and many more functions. Datapine is available for a 14-day free trial and premium pricing starts from $249 per month. Additional user and storage packages start from $12 per month.
SAP Analytics Cloud
SAP Analytics Cloud is widely used by small, medium and big corporations to plan and visualize their data and analytics. It offers a wide range of business intelligence and planning features such as self-service data modeling and preparation, augmented analytics, what-if simulation, predictive planning, scenario planning, data exploration and visualization, etc. SAP Analytics Cloud can also connect with a huge number of on-premise and cloud data sources such as SAP Business Planning and Consolidation, SQL, OData, Google BigQuery, etc. The demo is available on request and standard pricing starts from $432 per user per year.
Zoho Analytics
Zoho Analytics is a cutting-edge and powerful dashboard builder tool to connect, prepare, analyze and visualize the raw data into meaningful insights and reports. It supports integration with Google Analytics, HubSpot CRM, Microsoft Dynamics CRM, Google Ads, Facebook, QuickBooks, Shopify, etc., to connect, blend and view the data at a single place. It comes with an exquisite user interface for data integration and preparation, visual analysis, augmented analytics, unified business insights, collaborative analytics, data storytelling, embedded BI, etc.
It also offers flexible deployment options, smart AI assistant, mobile device access, etc., for easy extraction and visualization of data. The company offers a 30-day free trial for the on-premise version and a 15-day free trial for the cloud version. The premium pricing starts from INR 960 per month billed annually.
Which Industry Can Benefit From Dashboard Software?
Dashboard tools are widely used across various industries ranging from retail and finance to insurance and manufacturing for the collection, analysis, interpretation and visualization of data aimed at strengthening the operational efficiency, forecasting and many other functions. Some of the trending dashboard tools that are used by businesses in these industries are as follows;
Dashboard Software for the Retail Industry
Dashboard software provides an upper edge to the retail businesses while helping them save resources, cost and manpower in monotonous tasks. Dashboard tools for the retail industry can collect, track, monitor and manage the complex retail data associated with orders, returns, delivery, shipping, sales, accounting, etc. with better visibility and flexibility. This helps them easily compare and analyze their data against the competitor for making necessary improvements to the business functions. Some of these tools are discussed below;
Ubiq
Ubiq is a must have tool for retail organizations in building interactive data dashboards, charts and visualizations to monitor user activities, sales, logistics, marketing and many more functions. It comes with a drag-and-drop interface, powerful user and access management, advanced analytics, dashboard themes, real-time reporting, etc., to acquire critical insights in a compelling way. Ubiq can also securely connect with multiple data sources such as MySQL, PostgreSQL, AWS, Azure, Redshift, SQL, Magento, Drupal, WordPress, etc. The premium pricing starts from $29 per month with a free trial.
Digital Shelf Analytics
When it comes to proven analytics suites for retail and eCommerce businesses, Digital Shelf Analytics is an eminent name that uses historical and real-time data to evaluate business performance. It is widely used to track KPIs and gain critical insights It uses artificial intelligence, data aggregation platform and diverse delivery modes to benchmark pricing strategy, monitor stock availability, improve hygiene factors, etc. The tool can also analyze online ratings and reviews to understand consumer sentiment toward a product. For demo and pricing inquiries, connect with the company.
Centric Visual Boards
Centric Visual Boards is a real time tool to reduce time to market, increase efficiencies and drive more sales in the retail industry. It is widely used in retail and eCommerce industries to orchestrate profitable assortments, merge data and images, deliver custom digital showroom experiences, optimize wholesale and retail sales execution, bridge financial planning, streamline multi-channel orders, etc. It comes with drag-and-drop suggested assortments, presentations and interactive line sheets with video and 3D capabilities for better visibility into data and operations. Pricing and demo-related information is available upon request.
Dashboard Software for the Finance Industry
In the finance industry, access to accurate data in real time is very critical to prevent huge financial losses that can be caused due to slight error or delay in the data. For this, dashboard creation tools are used by financial firms that help them in making informed decisions, monitor stock prices, track cash flow, access real time data, etc. These tools can also summarize different financial transactions carried out in a fiscal year for quick auditing and reporting purposes. Following are some popular financial dashboard tools;
Qlik Sense
Qlik Sense is a powerful dashboard software for the finance industry to access data-driven insights. It comes with automated insight generation, natural language interaction, predictive analytics, augmented analytics and many more capabilities to test what-if scenarios, generate models, make predictions, automatically generate relevant visualizations, etc. It uses AI, open APIs and built-in functions to improve cash management in banks, analyze loan book profitability, resolve various challenges associated with credit risk, embedded analytics, market risk, etc. Qlik Sense is available in several premium versions starting from $20 per user/month, besides a 30-day free trial.
Insight software
When it comes to quickly analyze, interpret and distribute financial reports without IT support, Insight software is a name one can trust. It is widely used by banks, consulting, loan providers, etc., for financial reporting, operational reporting, budgeting, planning, tax & compliance, accounting, embedded analytics, automation and data management. The tool supports integration with multiple data sources such as Oracle, SAP, Netsuite, SYSPRO, Epicor, Sage, etc. For demo and pricing, fill out the details on the website.
Sisense
Sisense is a well sought data visualization tool for financial managers, auditors and accountants in collecting financial data and modeling scenarios. It comes with multiple deployment options, attractive graphs, Git integration, conversational analytics and embedded analytics features for better data control, scalability and connectivity. Sisense can easily build stock trader dashboard, cash flow statement dashboard, balance sheet analysis, CFO dashboard, profit and loss dashboard, etc., to better represent financial KPIs. Customized pricing information is available upon consultation with the sales team.
Board
Board is a leading dashboard software to plan, simulate and report financial operations. Top firms like KPMG, Bankwest, HSBC, etc., use this intelligent planning platform to perform drag and drop analysis, real-time modeling, advanced data entry, conditional alerting and various other functions. It also helps create on-the-fly calculated metrics using Microsoft Excel like formulas. Pricing information is provided by the company after filling out a form on the official website.
Dashboard Software for the Insurance Industry
Similar to the financial industry, the insurance industry also uses dashboard tools to easily visualize and monitor their data in real time. Insurance companies mainly use dashboards to acquire real time insights into the productivity, efficiency, workflows, commissions and other aspects of agent’s working. Apart from this, they use dashboards to improve claim settlement time, determine net income and sales growth, round-the-clock accessibility, prevent revenue losses, etc. Below mentioned are leading dashboard software for the insurance industry;
Insurance Analytics Dashboard
Insurance Analytics Dashboard is a custom-built analytics tool for insurance companies in managing the entire customer lifecycle, from acquisition to maturity. It provides a wide range of dashboard templates and a unified interface for insurance claims overview, insurance overtime report, operational review, etc. The tool uses predictive modeling, machine learning and data mining capabilities to uncover patterns, identify trends and make predictions based on historical and real-time data. Pricing and demo information related information is provided by the company upon request.
Reveal BI
Reveal BI is an embedded analytics based dashboard tool for insurance companies to generate more leads, prevent fraud and predict risks, while simultaneously reducing costs. It is beneficial for insurance managers in quickly creating dashboards for insurance claims and enrollment using interactive data visualizations, predictive insights and advanced analytical features. Insurance companies, social insurance companies, property insurance companies, car insurance companies and travel insurance companies prefer Revel BI to track customer demographics and get a detailed overview of insurance claim metrics. It is available at a fixed yearly price that can be acquired by contacting the provider.
InetSoft
InetSoft, another insurance analytics tool, serves as a unified solution to create custom dashboards, evaluate multi-dimensional data and automate parameterized reports. Features such as quantitative analysis, predictive analytics and qualitative alerts distinguish it from others in managing insurance-related risks and meeting the anticipated KPIs. It is also used for agent performance analysis, fraud detection & prevention, geographic cluster analysis, claims management, etc. It is available in both free and premium versions with prices starting from $165/month billed annually.
Dashboard Software for the Manufacturing Industry
Manufacturers whether small, medium or big can use dashboard software to track production data, optimize quality control, monitor performance and efficiency of employees, identify problematic trends, check the inventory, determine asset availability, etc. Dashboard software greatly helps the manufacturing industry in quickly acquiring the relevant data into the entire production process to reduce the product manufacturing time and save production costs. Some of these dashboard software are as follows;
Alteryx
Alteryx is a comprehensive data analytics platform for the manufacturing industry to improve demand forecasting, inventory optimization and predictive maintenance. The tool comes with an intuitive drag-and-drop UI for data preparation and blending, advanced analytics, predictive modeling, event triggering, etc. Alteryx supports integration with 80+ data sources, 300+ drag & drop analytics automation tools, native connectors like Snowflake and Databricks, etc., to connect, visualize and analyze organizational data. It is available in a free trial to check the functionalities and afterwards, the one-time premium pricing starts from $4,950.
Informer
When it comes to next generation dashboard software for the manufacturing industry, Informer is a reliable name for data visualization, analysis and management. Its performance tracking feature distinguishes it from the competitors which help monitor overall performance, sales activities, suppliers, inventory, shipping, logistics, etc., to understand the downtime and quality issues. Pricing information can be obtained after consultation with the company.
MachineMetrics
MachineMetrics offers advanced analytics features to reduce downtime and increase manufacturing capacity. The tool comes with powerful production monitoring, condition monitoring, predictive maintenance, process optimization and various other capabilities to help manufacturers perform better with few resources. It uses data from machines, humans, ERP and many other systems to analyze the overall production process in real time. The tool has been widely used by large scale manufacturers for machine connectivity management, automated production tracking, real-time production dashboards, historical performance reporting, advanced user management controls, etc. It offers a free trial with standard pricing starting from $150 per machine per month.
Conclusion
With interactive visualization tools, you can bring meaning to the data of your company. In a single location, you can have the critical information required to manage an organization by employing dashboard software.
You can explore the critical measures, projects, goals, and action items of your company through dashboard software. The leadership team of the company needs valuable information mentioned in the dashboard.
In order to create an incremental and revolutionary approach to mobilizing your data, one needs to re-think with other revolutions in data analysis that are highly driven by AI and ML. To achieve business goals in the future, we can get to see dashboards that align with these technologies to create an exceptional experience. When we reach that stage, we shall come back again to this post and help you with more added inputs.
Hoping that this list of free and open-source dashboard software will help you in managing the complexity of running a business and will allow you to consolidate information from across your organization.
If you would like to explore more advanced software, you can check the complete list of best dashboard software solutions.
In case, you have tried any of the dashboard software, then feel free to share your valuable views on the same.