People are now prioritizing mobile devices to complete tasks that used to be done with a dozen other tools and channels. Not just that, smartphones have become the most preferred devices to access the Internet, and its overwhelming content, by a bulk of people. There are now a billion more active mobile connections than there are people in the world.
Interestingly, the average mobile usage continues to rise. With copious smartphone apps available to communicate, connect with friends, take and share photos, run daily chores, perform simple tasks, play games, read books, order food, arrange travel itineraries, manage personal finances, and whatnot, people frequently use apps. The mobile phone has become an indispensable personal assistant.
Naturally, the perpetual rise in mobile usage has compelled businesses to pursue pro-mobile policies, such as mobile applications and mobile-responsive websites, which emphasizes the smartphone experiences of consumers while they interact with the company.
Facebook was already a popular social networking website, but it really turned into a social media behemoth, and an advertising channel as it is today, only after rolling out their app.
But to create a successful app, it’s essential for app developers to understand what consumers want in a smartphone; what do and do not they prefer. Most importantly, what makes people continue using mobile apps? Our mobile app market research report focuses on global phone app usage, and dig out primary statistics for businesses and app makers alike.
About The Goodfirms's Mobile Apps Usage Survey
Goodfirms surveyed 450+ global mobile app users to study current mobile apps usage.
The participants are mainly males (68.55%). And the participant users belonged to ages - 18-24 (11.69%), 25-34 (56.85%), 35-44 (23.79%), 45-54 (6.85%), 55-64 (0.40%), and 65+ (0.40%).
The respondents are from the United States (29.84%), Canada (23.79%), the United Kingdom (15.32%), Australia (5.24%), India (4.44%), Germany (4.03%), Poland (1.61%), Bulgaria (1.61%), Ukraine (1.21%), Singapore (1.21%), and Others (11.70%).
Among the participants, 64.52% use Android devices, 62.90% use iOS devices, 2.82% use Windows 10 Mobile devices, and 0.81% mentioned using Blackberry OS devices, ensuring technological diversity for the comprehensive survey research.
The surveyed mobile users were asked extensive questions regarding their mobile apps usage like phone device details, app stores they use and reasons, mobile app discovery and download, dominating mobile app categories, daily and monthly app usage, app permissions, app deleting, and app re-installations.
Businesses and mobile app developers can utilize this report to get insights into common user habits and experiences. The trends in mobile apps discovery, download, and usage would help businesses in the mobile app industry to not only create a useful app but also to market them right for the targeted audience.
The Detailed Study
Since when Apple reinvented the phone, mobile apps have brought the world on fingertips.
“The best apps are the ones that combine exceptional utility and speed with great user experience. Apps should improve my workflow, not drag me down. I'm pretty quick to delete an app that doesn't help accomplish my goals.”
- Nate Nordstrom, Founder & CEO of BrandHoot
In his simple words, Nate revealed precisely what a mobile user generally wants from an app.
While a more extensive field of study includes popular app stores, app categories to reasons people delete an app; which founds the current composition of this research.
Jagatveer Singh, director of top user experience design company Walkwel Technology, talks about how recent mobile apps are serving their users precisely.
"We have to understand that our mobile screen is limited and there definitely is a maximum number of apps a user would like to have on his phone, at least unconsciously. While there are apps that want to be on everyone's phone, mostly offering their services for free and implicitly turning the user into a product they can sell, we have observed that new startups are really getting matured in targeting niche audience instead."
App-making businesses just not have to focus on the technical manifestation of an app, but they need to align their efforts with the user experience and needs if they are really aiming high.
Singh added, "They understand that if they provide the perfect solution to a problem that impacts a certain set of people, those people will be willing to pay in order to make their lives a little easier, hence generating revenue."
The present research presents details of how people discover, download, and use apps on their phone. Read the following research article to get detailed insights, supported by apps stats, into Goodfirms's Mobile Apps Usage Survey:
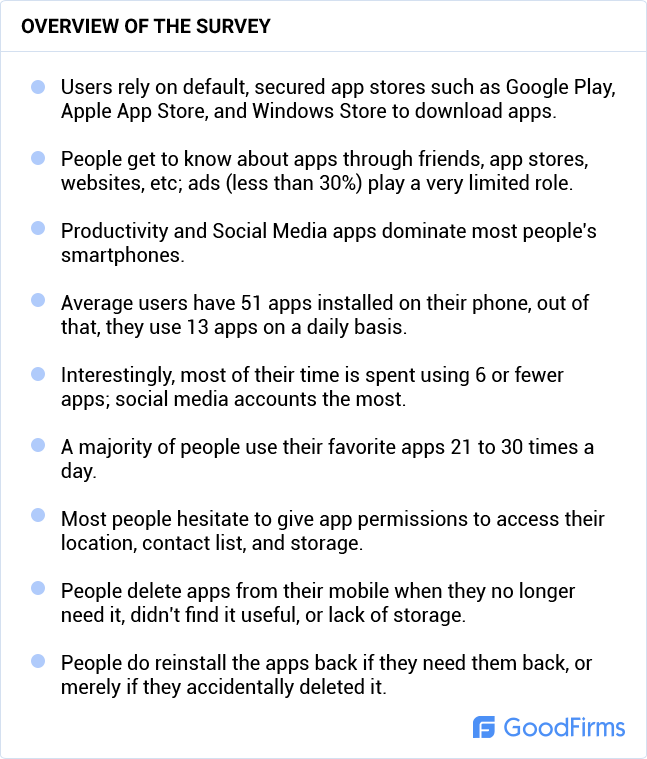
Default App Stores Emerge the Most Popular Among Users
During the survey, people were asked to mention which app stores they use to download apps and why.
Google Play Store (64.52%) and Apple App Store (62.90%) are the most used apps stores.
Windows Store (2.82%) did not wield a majority, but all of the Windows phone users, who took this survey, mentioned the app store as their primary source for apps download.
The mobile app download statistics derived from their responses are as figured:
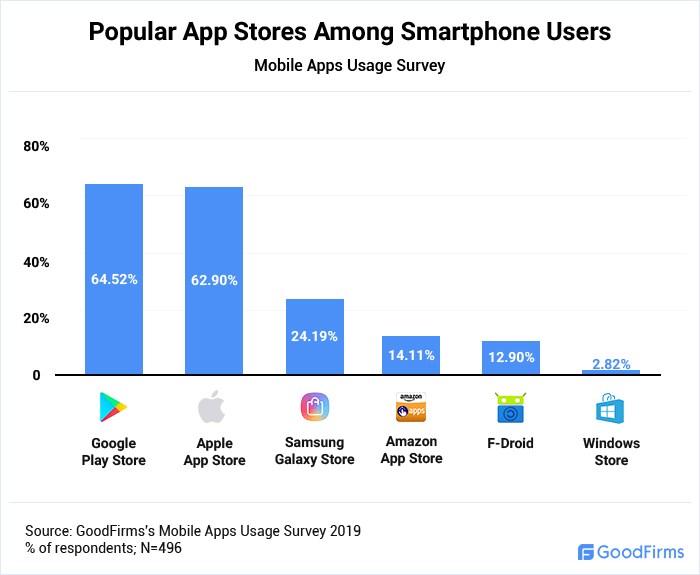
Other app stores such as Samsung Galaxy Store (24.19%), Amazon Appstore (14.11%), and F-Droid (12.90%) are much less popular compared to the two big ones.
The fact that Play Store comes default with Android devices, and App Store with Apple devices, is the major reason why almost everyone (97.18%) rely on these platforms for discovering and downloading mobile apps.
Here are the app download stats depicting several reasons why people prefer popular app stores:
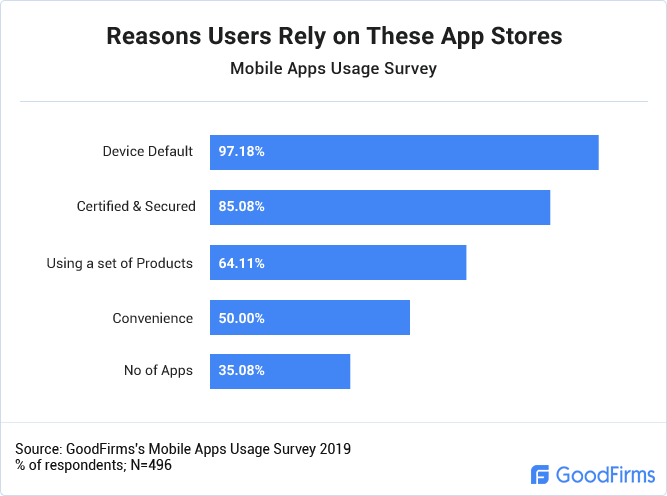
Also, all the apps that are available on these platforms are verified, secured, and certified, which was attributed as another major reason by 85.08% of the respondents.
64.11% of the people said that they prefer using a certain app store because it can be used across all the other devices they own.
Additionally, 50.00% of the surveyed choose a platform that is convenient, easy-to-use and offers a wide variety of apps.
While 35.08% of the users look out for a particular app store considering the number of apps available on the platforms.
How Consumers Discover Mobile Apps?
People have a problem to be resolved and a requirement to be fulfilled, they ask a friend, search on the App Store, or even on a search engine looking for a fit. Having said that, these mobile app users statistics show that they find new apps organically, even more than through commercials on different platforms.
More than one-third of the respondents get to know about mobile apps organically (except one).
While less than one-third of them get to know through ads (except one).
Organically
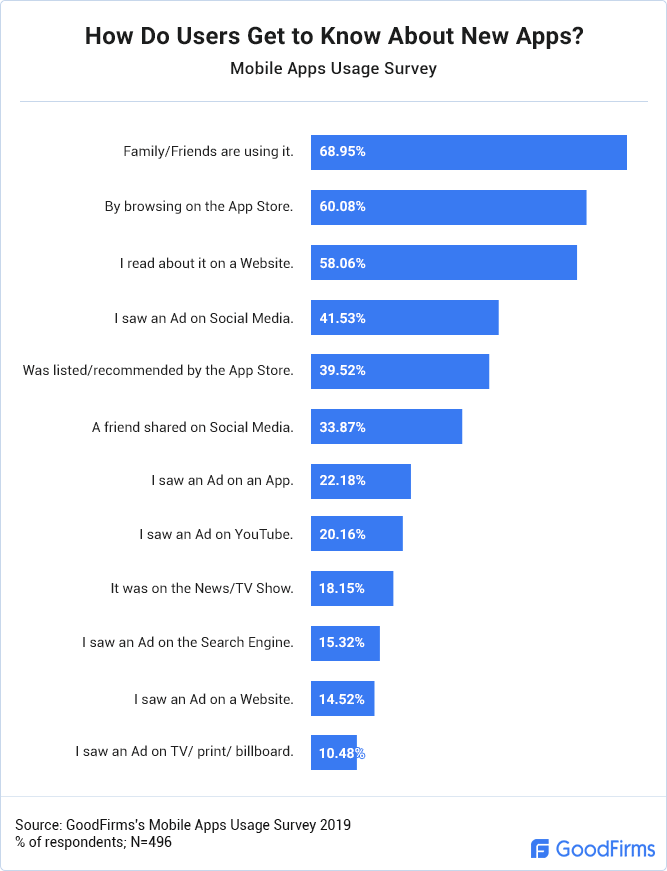
- The largest percentage of participants (68.95%) say that they usually find about mobile apps through family/friends.
Mobile apps get easily recognized, downloaded, and used when recommendations come from close ones, trusted sources. In many cases, people even get on with the app merely because of a certain kind of FOMO.
An experience shared by Azman Nabi, growth marketer at Webisoft, proves the point. Talking about his recent experience with PUBG game, he said, "I knew about the game from a while but never downloaded it because I knew it can get addictive. But then, one of my friends asked me, or say, insisted me to install the game and play with him. That's the point when I started playing it. But, I must say it's an addictive game, especially because of the environment PUBG mobile created by socializing with friends while playing."
- Additionally, 60.08% of smartphone users said they browse on the app store for app discovery.
- While 58.06% of the users rely on websites to search, get details, and find reviews for new apps.
- Other ways people discover an app organically were app store listings/recommendations (39.52%), social media shares (33.87%), and news/TV shows (18.15%).
Through Ads
- About 41.53% of the surveyed people - who got to know about a new app through ads, they found it on social media.
People spend a prodigious number of hours on social media, continuously absorbing news, information, as well as entertainment. Naturally, the platform becomes the most essential for displaying ads.
- Ironically, the second biggest ads platform recognized was mobile apps display, as mentioned by 22.18% of the people.
- And the third biggest ads platform turned out to be Youtube, as credited by 20.16% of the surveyed users.
- People even find new mobile apps through advertisements on search engine (15.32%), website (14.52%), and traditional media (10.48%) such as TV, print, billboards, etc.
Productivity Ranks First Among Most Used App Store Categories
There are 32 app categories available on Google Play and 28 on the Apple App Store. Yet, only 4 of them dominate the smartphones of more than half of the users.
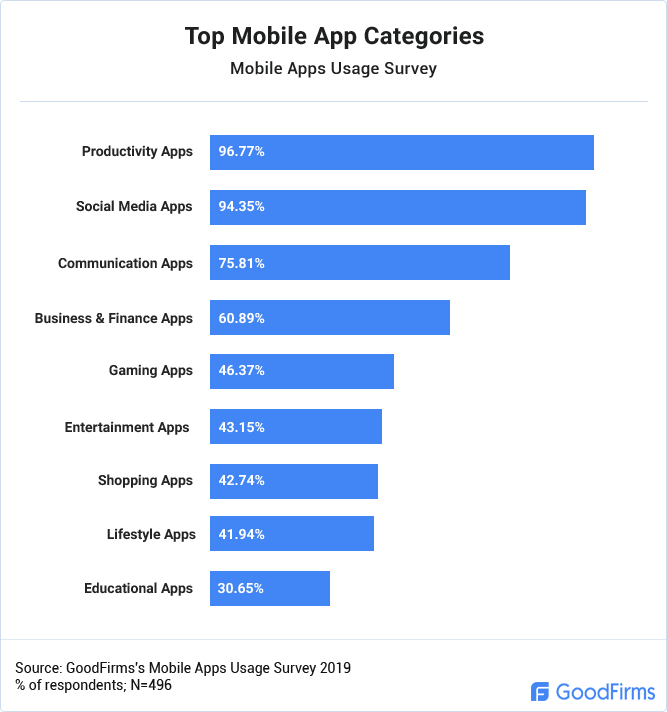
For 96.77% of the users, Productivity Apps are the most dominant kind of apps on mobile.
Participants were asked to indicate which app categories are predominantly present on their smartphones. The mobile app statistics are rendered below:
The day mobile devices started including apps that can assist you in simple, specific tasks in addition to communications, the path to smartphone evolution had begun. Today, the world is preoccupied with productivity, and current mobile app industry trends suggest smartphones are constantly evolving. These apps include a great majority of apps from simple apps such as clocks, calendars, calculators, notepads, to high utility tools such as data viewing, cloud storage, audio-video, backup, and much more.
Social media apps rank second with votes from 94.35% of people. Interestingly, most of the people use at least 4 social media platforms daily, while smartphone applications provide them convenient access to these virtual networks.
As stated by 75.81% of the surveyed users, communication apps such as calling, messaging, chatting, email, contacts, address books, etc ranked third among people's mobile app categories.
Also, 60.89% of the surveyed even mentioned substantial use of business & finance apps. The fact implied that apart from personal usage, not to mention personal finance, smartphones have also become an integral part of people's workplace culture.
Gaming apps were reported being dominant on their phones by 46.37% of people. While, entertainment apps, such as music and video-streaming, was heavily used by 43.15% of the respondents.
Among other app categories, shopping apps (42.74%), lifestyle apps (41.94%), educational apps (30.65%) remarked considerable mobile app usage.
People Use 25.49% of Installed Apps Daily on Smartphones
Every day, new smartphones get launched; with advancing technology, key mobile specifications get better and better. Subsequently, mobile users are spending more time on a range of apps due to improved handset performance and mobile phone storage capacities.
According to the survey, people use about 13 apps a day, out of 51 installed on their mobile phones.
During the survey, participants were asked to roughly estimate the number of apps installed on their mobile, and the number of apps used at least once a day. The app usage statistics from the survey are as below:
- On average, people have 51 non-native apps installed on their mobile.
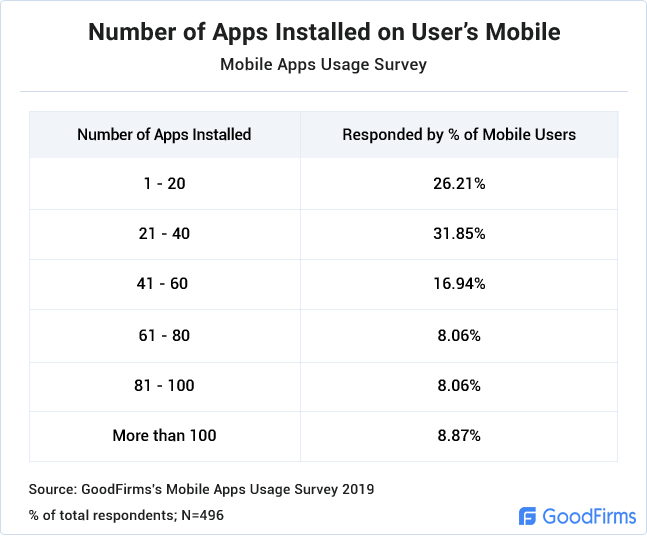
- On average, people use 13 apps a day.
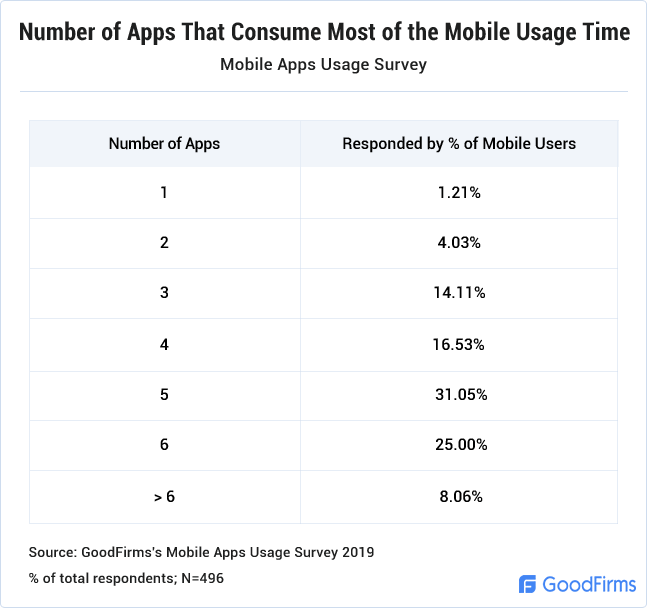
Social Media Are the Most Used Apps
Though people use as many as 13 mobile applications per day, the majority of users’ time is spent using only a few apps.
92% of people spend the majority of their mobile time on 6 or fewer apps.
When the surveyed mobile users were asked to indicate the number of apps that consume most of their time, the mobile apps statistics are as follows:
Also, the participants were asked to mention the apps that consumed most of their mobile sessions. The mobile apps statistics derived from their responses are as below:
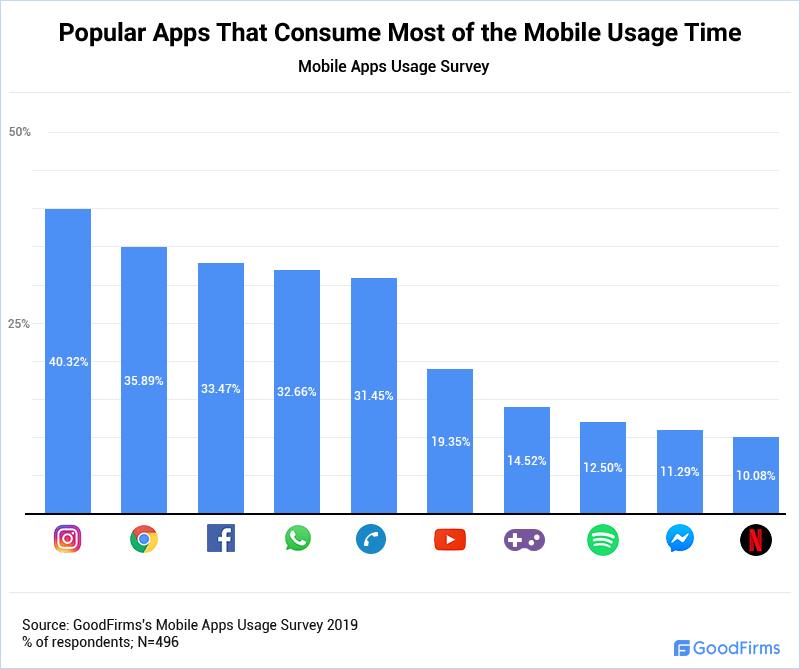
- Social media apps such as Instagram (40.32%) and Facebook (33.47%) ranked among the top three most used apps.
- Google's web browser Chrome ranked second most used mobile app, with 35.89% of the users spending most of their time on the app to browse millions of websites and web-apps every day.
- Also, mobile users spend much of their time chatting over popular texting apps like WhatsApp (32.66%) and Messenger (11.29%).
- Around 31.45% of the people reported that the device's calling app is the most used mobile app.
- Entertainment apps such as YouTube (19.35%) and Netflix (10.08%), as well as music playing app Spotify (12.50%), are also mentioned as consuming most of the time spent on apps.
- Around 14.52% of the people even cited that game-playing consume most of their mobile app usage.
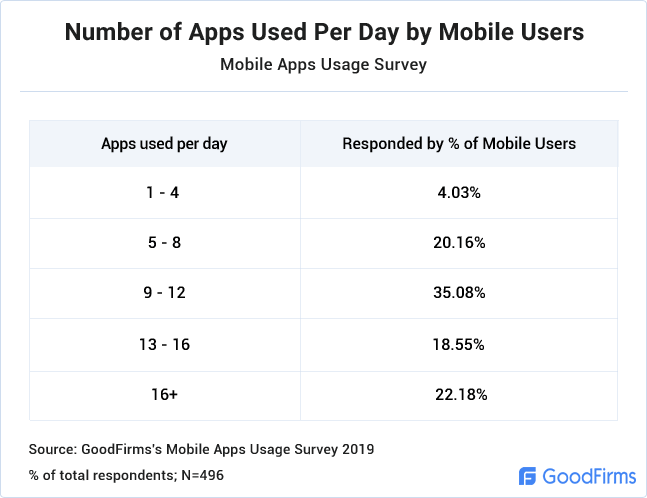
Most People Frequently Use Apps, as Many as 21 to 30 Times a Day
People do not binge use mobile apps, except for some entertainment category apps. It's obvious that people use apps on their phone multiple times a day, and also, for varying durations of mobile usage.
So the surveyed users were specifically asked to state how often they use the above mentioned mobile apps in a day. The mobile apps stats are detailed as follows:
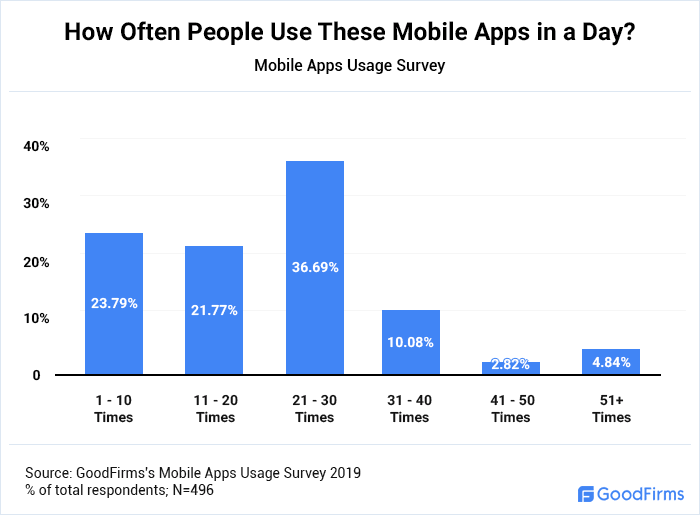
Considerable chunks of respondents use their most used apps for 1 to 10 times (23.79%) and 11 to 20 times (21.77%) a day.
The majority (36.69%) of the surveyed utilize each of their most used apps 21 to 30 times a day.
21 to 30 times spent on apps a day is analogous to using them almost every hour of the day. And as above mentioned, the majority of people use 5 apps that consume most of their day. That's the rough equivalent to people using 5 apps every hour of the day.
Only fewer people heavily use apps on their mobiles such as 31 to 40 times (10.08%), 41 to 50 times (2.82%), and 51+ times (4.84%) a day.
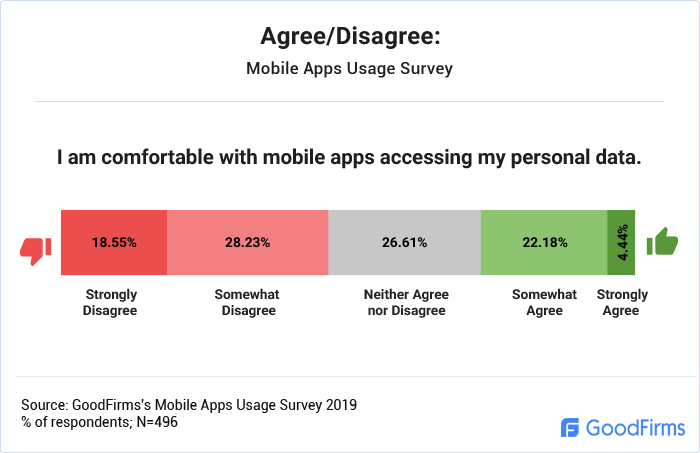
Users Hesitate to Grant Most Mobile App Permissions
The surveyed people were asked to agree/disagree with the statement - "I am comfortable with mobile apps accessing my personal data". While 28.23% of the people somewhat disagreed with the statement, other 18.55% strongly disagreed. On the other hand, 22.18% somewhat agreed, and only 4.44% of them strongly agreed. While 26.61% neither agree nor disagree.
People were even asked to indicate how often they grant the principal app permissions to a mobile application, among the given choices - Never, Rarely, Sometimes, Often, or Always.
A majority (31.85%) of the people always enable an app to call.
While more than a quarter (27.82%) never permit access to data storage.
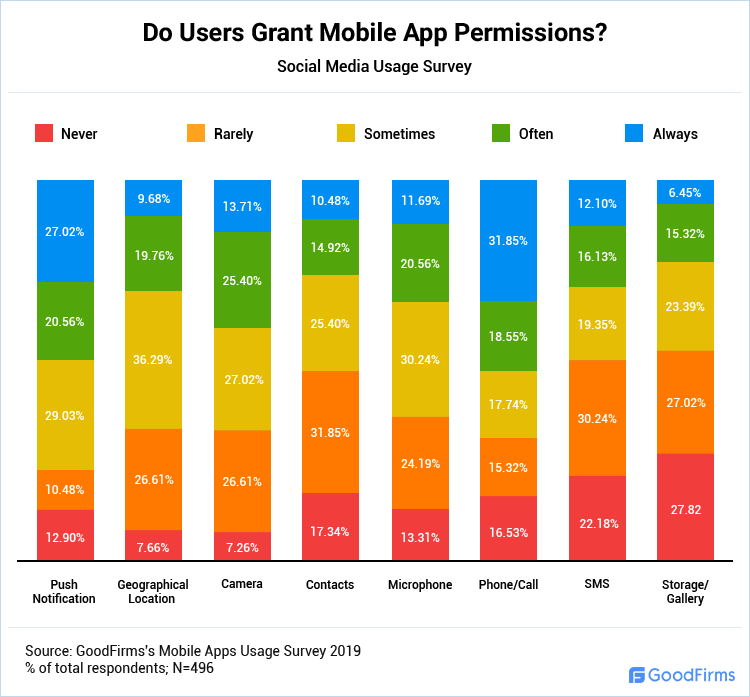
Usually given app permissions:
- More than three-fourths (76.61%) of the surveyed sometimes, often, or always permits a mobile app to show push notifications.
- Two-thirds (66.13%) of the respondents let an app to use their mobile's camera. While a majority of them allowing only a few selected ones, and on a few selected occasions.
- Many (68.15%) of the surveyed users sometimes, often, or always give app permissions related to call.
Usually denied app permissions:
- A majority (70.56%) of the users usually don't allow an app to access their geographical locations, allowing almost never to sometimes.
- Almost three-fourths (74.60%) of the people never, rarely, or sometimes allow contact list access to an app most of the times; while a majority of people rarely do.
- More than two-thirds (67.74%) of the users never, rarely, or sometimes allow an app to use their mobile's microphone; while a majority of them sometimes do.
- Most (71.77%) of the respondents mostly deny SMS access to an app, with a majority of them rarely doing it.
- Almost four out of every five (78.23%) users hesitate to give an app access to its mobile phone storage, which is quite natural, owing to recent data scandals and privacy issues.
Of course, all of the above choices depend upon the kind & frequency of using apps, and also, the basic requirements for an app to function.
As Vincent Mouton, office manager at Sidekick Interactive, points out, “I will always let Snapchat [for example] access my camera, but if it's a weather app, I will never allow the app to access my camera. It's all about the app I'm using and the relevance of the feature they want to access.”
Major Reasons Users Uninstall Mobile Apps
When mobile users were asked if they have uninstalled an app recently, 65.32% of them replied in affirmative.
29.84% of the users uninstalled an app, they no longer needed.
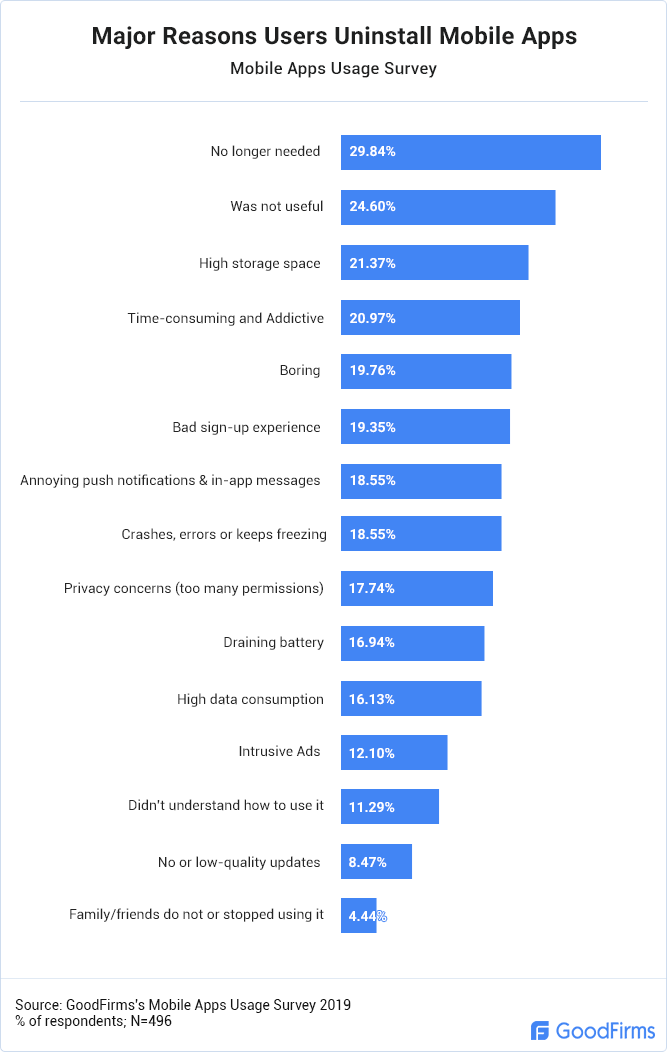
While this number is not close to a majority, but people do uninstall an app once the purpose of an app is served, to avoid cluttering on their device and hampering mobile performance.
The second major reason people (24.60%) stated was they didn't find an app useful enough. Either the app provided no value proposition or was available at the website; in later's case, people tend to bookmark the webpage. In any case, apps that don't save time, save money, or provide entertainment gets uninstalled easily.
The size of the mobile app matters to smartphone users too. As 21.37% of the participants have reported that they uninstall apps that take up a lot of storage in favor of lighter versions, or even, alternatives.
Interestingly, as many as 20.97% of the surveyed users reported that they delete an app if it gets addictive and time-consuming. As Hope Ekpo, Founder & CEO of Greenedu Digital, shared a personal experience, "There was not a single day when I didn't think of playing Top Eleven. Though it was a wonderful app, I had to delete it because it became so addictive and frustrating. Addictive in the sense that it takes most of your time and frustration in terms of getting angry when a weaker team beats you. In order to get myself together, I had to delete the app."
19.35% of people uninstalled an app, having gone through a bad sign-up experience, high customer criteria or asking for too many personal details. And 17.74% of other users even deleted apps that ask for too many permissions, which they find objectionable for the app.
Other major reasons mentioned by respondents are boring apps (19.76%), annoying push notifications & in-app messages (18.55%), technical errors or crashes (18.55%), and draining battery (16.94%).
Major Reasons Users Reinstall Mobile Apps
When mobile users were asked, only 31.45% of them reported reinstalling previously uninstalled mobile apps.
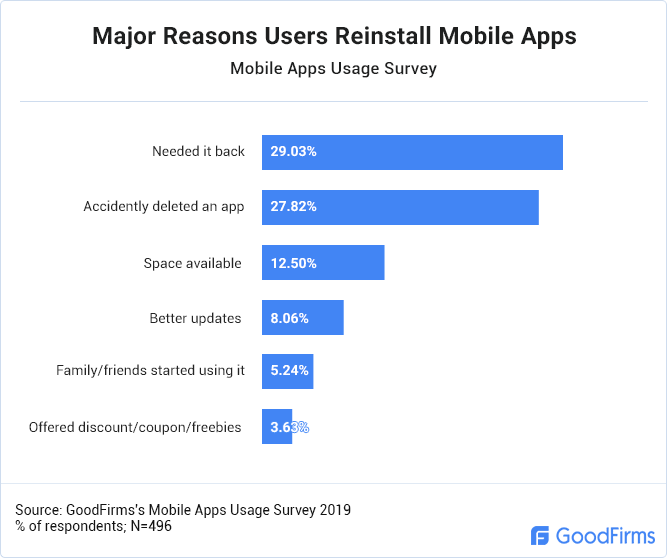
29.03% of people reported that they needed an app again, which prompted them to reinstall the app.
People usually rely on the same app for a certain service.
People trust tried and tested apps for superior user experience and service satisfaction. And even if they have to delete the app for some reason, they tend to download it for the time being when they are in need of that particular service.
Yet, 27.82% of users noted re-installing an app simply because they accidentally uninstalled that app. It's quite common that people uninstalled an app mistakenly while they are freeing up some storage space on the smartphone. Or people having access to their phones such as children, parents, spouses, etc. have uninstalled a particular app without even the knowledge of the user. In any case, people have no intention to delete the app and tend to install it back.
Users even download an app again, if enough storage space on their phone is available, as stated by 12.50% of them. Usually, when people change their smartphones, they opt for high spec handsets which can provide them with larger storage and better performance to store heavy apps too.
High uninstall rates may force app makers to focus on the quality of app usage experience, which leads to a dynamic process of bug fixing, timely updates, the addition of useful features, and much more. For some (8.06%) users, an updated app is essential and they even reinstall the app again.
Few (5.24%) of the people stated that they downloaded the app back as their friends and family started using it. While for some (3.63%) other users, specific offerings such as discounts, coupons, and freebies can lure them and give a boost of app re-engagement.
Conclusion
These stats imply that people rely on their mobile apps for most of their requirements, and do have app favors if served with a powerful experience. Productivity and socializing still remain public inclinations when it comes to app download and usage. While a considerable few - mostly social media, games, and entertainment apps - consumes most of their time spent on apps.
If you belong to the mobile app industry and feel intimidated by these smartphone apps statistics; don’t worry too much. If your business needs an app extension for your services, you can outsource your project to Goodfirms listed app development companies, which not only delivers with exceptional quality and efficiency, they also set you up for future success.
As consumers are spending more and more time on mobile, and use apps to do most of their tasks, businesses will need to grab the opportunity. And when it comes to this enormous mobile app market, a seamless user experience is key to successful monetization. Thus, businesses need to have mobile app designers who can get your app simple yet intuitive user-experience backed app designs.