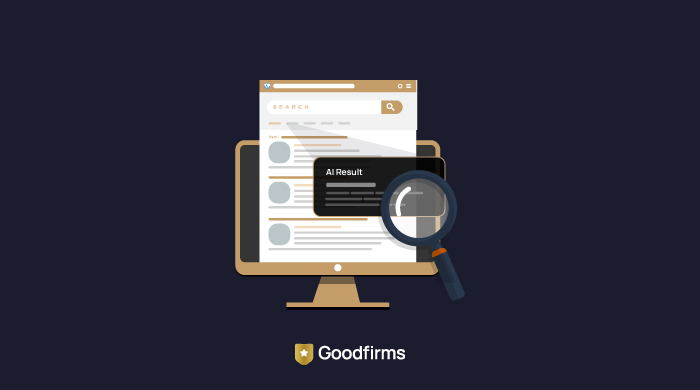
Almost every business across various industries is experiencing digital disruption. The majority of the people have smartphones, and they spend more time on social media and other related digital mediums, creating a huge virtual market and potential customer base. For entrepreneurs, an online presence has become mandatory. And that is not enough; one must have the information about how people get to their website, what they do once they land, and if they "convert" to the defined goals or not. Analytical platforms, such as Google Analytics provide data visualization to entrepreneurs, and the SEO companies can take their efforts in the right direction to help them survive in the digital age.
Launched in 2005, Google Analytics is a free and most widely used web analytics application that profoundly measures customer journeys, while accurately understanding individual user experience and engagement across different channels and devices. Thus, with valuable insights, one can improve the performance of their website and increase conversions. Goodfirms surveyed 80+ Marketing Experts worldwide to find out which Google Analytics Metrics analysts must track to analyze in-depth detail about the visitors on their website.
What is Google Analytics(GA)?
With Google Analytics, one can generate various preset and customized reports. At the left-hand side of the dashboard, predetermined reports are listed down, divided into the segments Real-Time, Audience, Acquisition, Behavior, and Conversions carried out on the site. By analyzing these reports, analysts can have a comprehensive understanding of the complex data, from a website's audience demographics to the channels through which they land on their website. Accordingly, they can make changes in the marketing strategies to meet the goals.
Umarah Hussain, PR & Outreach Executive at Colewood holds Google Analytics in very high regard, she says,
"One of the most favored marketing tools in every marketer's metric handbook is Google Analytics. Saying this, there is an array of certain metrics that must be tracked on Google Analytics out of the 200 metrics that span the entire funnel (from acquisition to sales)."
Google Analytics utilizes machine-learning capabilities to create a deeper understanding of individual users. But what makes it more compelling is that several different applications seamlessly integrate with Analytics, and there are many useful Add-ons available. Let us find out what data visualization tools experts prefer to complement Google Analytics.
Data Visualization Tools to Integrate with Google Analytics
63.75% of the surveyed experts unanimously agree that Google Analytics on its own is sufficient for them.
Utilizing Google Analytics reports since long, Toni JV, SEO Consultant & Founder at JVT Media does not use any data visualization tools, because he believes,
"Google Analytics gives me more than enough data and visualizations to analyze my data. That is why I don't see a reason to overcomplicate the process."
Toni shares an interesting example of how Google Analytics has helped them to build relationships with authority brands.
"I noticed one page was showing a sudden spike in traffic. I then used this knowledge to dig deeper into where it was coming from. What I then realized was that an authoritative brand had shared my article in the SEO niche. It now opens up a huge opportunity for relationship building with that authority for me and lets me dig deeper into what made my content helpful enough where they'd want to share it. I can now inject elements of what made that article valuable into my other articles."
But 36.25% of the surveyed professionals use Google Analytics in conjunction with various data tools. They believe that analytics being compatible with the rest of Google's marketing products (including Search Console, Google Ads, Data Studio, etc.), is an excellent opportunity for marketers! For them, it is a more accessible way to see and understand trends, outliers, and patterns in data.
"At SEMrush, we cannot limit ourselves to using only Google Analytics, so we collect all the data in BigQuery and visualize it using Tableau. In our daily work, we mostly use Tableau. But Google Analytics has its benefits too. Mainly I use the "Acquisition" report and everything that this report includes: Google Ads, Google Search Console, etc."
- Ruslan Shogenov, Product Marketing Manager for SEO toolkit at SEMrush
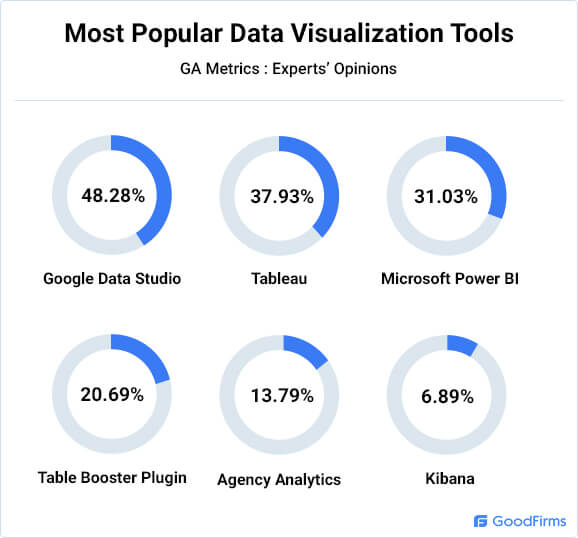
Out of all the analysts who use external data tools - 48.28% of them declare Google Data Studio as the best and indispensable tool, making it the most popular data visualization platform. Tableau is another powerful and fastest-growing data visualization tool used in the business intelligence industry.
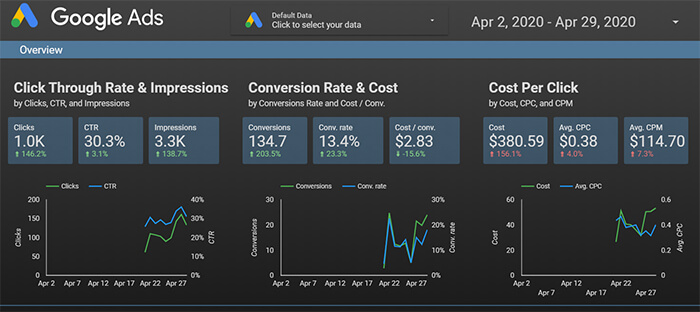
Example of Google Data Studio Report
Data Studio allows businesses to select from the diversified graphics, charts, and tables to transform data into a useful report and share findings with stakeholders and collaborate with others. Chris Casarez, SEO Manager at Your Marketing People, likes to use Data Studio for having intuitive and interactive reports.
"This is a huge factor in our reporting. As great as Google Analytics is, it's not always intuitive for clients or other stakeholders. Data Studio allows us to report GA data in a more consumable, detailed fashion."
Other popular data tools that can be used with Google Analytics include Microsoft Power BI, Table Booster Plugin, Kibana, etc.
The 10 Most Important Google Analytics Metrics According to Experts
One must necessarily understand dimensions and metrics - the building blocks of the reports in Google Analytics. While dimensions help marketers describe the data, metrics let them measure the data.
Usually, a group of metrics builds a dashboard that analysts or management review on a regular basis to assess performance and build marketing strategies. Given below are the most important metrics that market experts are keen on commonly observing to gauge the health of the business or a particular ad campaign.
1. Users
The very first metric found on the GA home screen after signing in is the number of users, which differs with the timeframe that one selects (today, yesterday, last 7 days, etc.)
Two types of people visit your website - those who have been there before, and those who have not.
In Google Analytics, Users define the number of visitors landing on your website, meaning new plus returning visitors. New users are the ones visiting the site for the first time during that period. And when someone visits your website n number of times on the same device or browser, they get counted as one user. Google Analytics categorizes these repeat customers as returning users.
The point to keep in mind here is - if a user changes devices/browsers on a return visit to your site, or deletes the cookies, and returns to it subsequently, they are considered as a new user even though they should be counted as returning users.
To find Users, navigate to :
Audience > Overview
You will see a table, where you can have a closer look at Users.
Alex Chenery-Howes, SEO Executive at Yellowball, admits paying the most attention to users, new users, and conversions via organic traffic.
"We find that attracting new users via search engines is the best indication of organic, sustainable growth. As well as this, conversions help us ensure that we aren't gaining traffic with no strategic value. Otherwise, we would fall victim to 'vanity metrics' - numbers that merely look positive but don't indicate long-term value."
Despite not being 100% accurate, the 'Users' metric can be beneficial in measuring visitors that initiated at least one session on your website during a specified period of time.
2. Web Traffic Sources
The web traffic sources metric measures which traffic sources are sending visitors to your site, and lets you compare each of those sources. The three main traffic sources are - direct, referral, and search, although campaigns such as banner ads or paid search can also drive traffic to your website. You can have more granular information about your web traffic by analyzing each traffic source.
In Google Analytics, the Source/Medium report gives you the details about your social media traffic, such as the identity of each traffic source, the audience you’re getting from that source, how those visitors are engaging with your site, and the results of their interactions.
To access the Source/Medium report, navigate to
Acquisition > All Traffic > Source/Medium
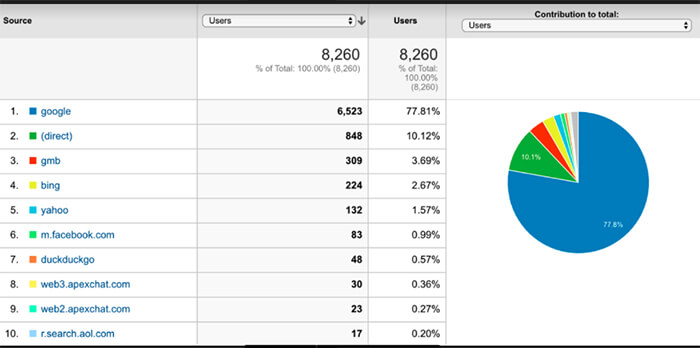
Skyler Reeves, the Founder of Ardent Growth, has found that some businesses, like law firms, benefit more from focusing the effort on their regular organic result instead of their ranking in the maps.
"Had we not identified this, we likely would have spent more effort trying to rank them higher, so they showed up in the Map Pack at the top of the search results. Seeing how ineffective that would be saved us a lot of time that would have otherwise been wasted. In the screenshot I’ve attached you can see that traffic from organic clicks (google) accounts for nearly 78% of the traffic to this site during the past 2.5 months vs. traffic from Google My Business (GMB) accounting for less than 4%."
Each source helps you gauge the health of your website. For example, a high volume of referral traffic shows that 3rd party websites or people on social media sites are frequently talking about your brand or website.
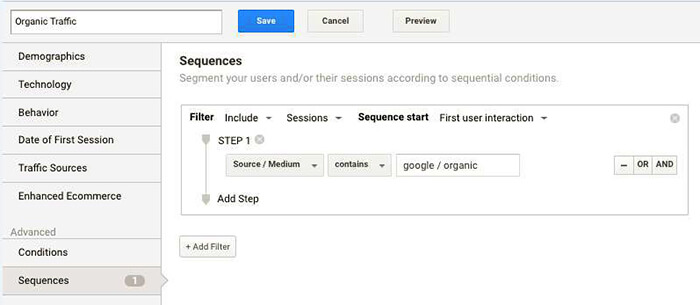
Brandon Cook, Director of Marketing at Clean Origin, informs how organic traffic metric helped them identify and confirm a strategic approach to build relevant, high ranking content.
Brandon likes to find more organic traffic by identifying top-performing organic pages. He says, "First, you must use a Segment. For this, you must identify sessions that start with the source / medium combination you desire. For this, I used 'contains' 'google / organic and set the sequence starting with the first user interaction. From there, navigate to Site Content > All Pages and you will have all of the landing pages that were accessed through google / organic. What we look for is month-over-month changes to see traffic growth to specific pages. You can access this information a number of different ways, but we love using segments to build cohorts of customers."
By adding the web traffic sources metric to your SEO performance dashboard, you can dive deeper into your marketing efforts.
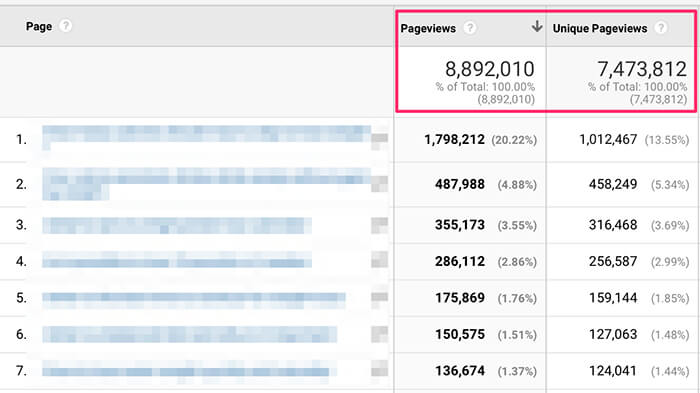
3. Pageviews
Pageviews is the total number of loads/reloads/revisit of the same page within a single user session for a given period of time. So, it can include multiple views from the same user session. In short, the total number of pages viewed is a pageview. And 'Unique Pageview' in Google Analytics represents the total number of sessions when a specific page was viewed at least once.
To have a closer look at Pageviews, navigate to
Audience > Overview
One can also find Pageviews by navigating to
Behavior > Site Content > All Pages
With the pageviews metric, you can have insight into how compelling and popular a specific page is. To create high-traffic content, use a page with high pageviews as a template. Though some analysts do not think of pageviews as an important metric on its own, they agree that pageviews and unique pageviews are necessary to create a baseline of growth and popularity for the website. And when combined with other data, it can help you understand more about visitor behavior and your website.
Zach Passarella, Marketing Director at Supplement Manufacturing Partners Inc. tells how they decided to focus more on link building by analyzing pageviews.
"Analytics has made us come to the conclusion that there are some pages that would not be getting any traffic for various reasons. The pages that were lacking visits needed more links to help drive potential customers to those important pages."
You can have a look at the unique pageviews metric to see the number of sessions for a page. To find the average number of times a particular page was viewed per session, divide the number of pageviews by the number of unique pageviews.
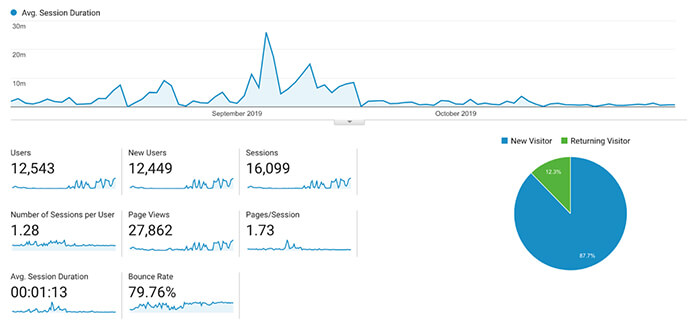
4. Average Session Duration
A session is - one user's group of actions(browsing pages, downloading resources, purchasing products) within a given time frame that starts when a user enters your site and ends in three conditions. That is : after a specific time of inactivity or a change of campaign or at midnight. By default, a session lasts until 30 minutes of inactivity in GA.
The time that an individual user spends interacting with a website is - session duration.
-
"Session Duration" report can be found under
Audience > Behavior > Engagement
Average Session Duration is a metric measuring the average amount of time that users spend on that particular website.
-
Analysts can have a look at Sessions and Average Session Duration by navigating to
Audience Report > Overview
-
To see an overview of your pages and their average session durations, navigate to
Behavior > Site Content > All Pages

Kaspar Noé, Founder at Advertik Media, says,
"Average session duration on our search-optimized posts gives a clear indication if people enjoy consuming the content and gives us a clearer understanding of our target audience. The more time spent, the more valuable the source of information is for the audience."
Average session duration can be increased by including videos and engaging images, understanding the customer's journey, making interfaces user-friendly, linking to other pages of your website, etc.
Several significant metrics, such as bounce rate and pages visited per session, get affected by average session duration. If Average Session Duration of a website is more, the bounce rate will be less, and pages visited per session will most likely be more.
5. Goal Completion
To locate Google Analytics Goals:
- Navigate to your Google Analytics standard reports.
- In the top right corner, click on the Admin.
- Click on Goals
- Click + Goal to set up a new goal from one of the Goal sets
A fundamental component of any Digital Analytics measurement plan is defining goals, which enables you to track specific user interactions such as form submissions, leads collection, product purchases, and more on your website. Goals let you measure how efficient your site is in fulfilling your target objectives. Generally, company websites fall into three core categories:
- eCommerce(goal - make users buy something)
- lead generation(goal - make users submit form)
- content(goal - make users engage with the brand community or sign up to receive content)
Goal Completion measures the number of visitors who have completed a particular goal on your website/mobile app, such as subscribing to a mailing list or signing up for a trial.
To find Goal Completion Metric:
Behavior > Site Content > Landing Pages
Acquisition > All Traffic > Source/Medium
Goal Completion is an important part of the purchase funnel as it mainly indicates your conversion rates from the awareness stage to the consideration stage. It is a leading indicator of how effectively your website resonates with your target audience and so it is used widely in website optimization.
Elmer Taboada, Marketing Manager at DaVinci Tech, informs how goal completion metric has helped them increase their conversion rate.
"Landing page for our marketing campaign for a product sale didn't meet expectations as fewer people converted. Using our goal completion metric, we found that the problem lies with our ads since it sent lower traffic than what was expected. After a few modifications in our ads, we started seeing a boost in our conversion rate."
Ultimately, every marketing strategy is planned around generating traffic and meeting the goals. But some marketers often resort to click-baiting, which is generally the deliberate act of over-promising or otherwise misleading information — mostly in a headline, on social media, in an image, or some combination to drive page views for the websites.
Providing a classic example of click-baiting, Elly Wilson from Trendz Plus shares how Google Analytics helped them come to an understanding.
"We use goal tracking on all our services. We have many vendors who bring in visitors from their website to ours. By tracking goals, we can see which vendor brings the most visitors, the service they choose, how many of them go to our cart page, how many of them make an actual purchase, and how many of them are returning customers.
From an image given below, you can see how we are getting 663 visitors from one particular source.
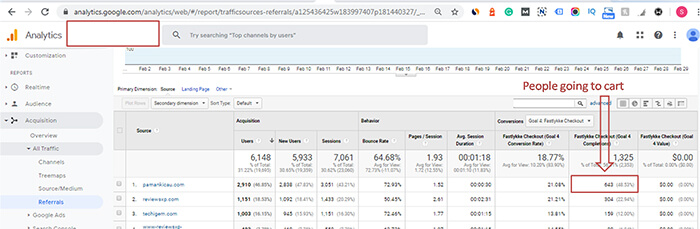
And now see the actual number of people who bought our service.
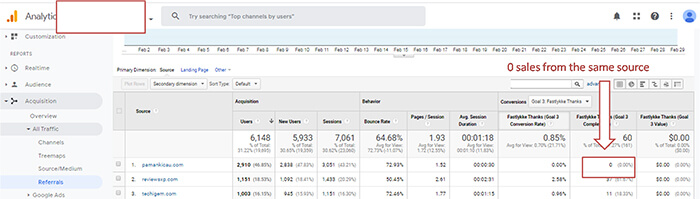
From one source, 643 people went to cart, but none of them made any purchase. Reason? The source was proclaiming that we are selling our services for free. This is one classic example of click-baiting."
6. Goal Conversion Rate
When a user performs a specific action, defined as a goal on a website, GA records that as a conversion. With properly configured goals, Analytics can provide the site owner with essential information about the number of conversions and the conversion rate for their website or app. This knowledge makes it possible to evaluate the effectiveness of their online business as well as marketing campaigns.
To find Goal Conversion Metric, navigate to
Behavior > Site Content > Landing Pages
Acquisition > All Traffic > Source/Medium
The conversion rate defines the percentage of users performing the desired actions such as buying a product, subscribing to a list, clicking on a link, etc.
Grafton Robinson, Founder at SafariGrowth, provides great insights about conversion actions and explains,
"Google Analytics uses the formula [(Conversions)/(Sessions)]*100 to get the conversion rate. This makes sense if you're tracking something that matters session by session, like pages per visit, or time on site. However, many conversion actions are more accurately measured by dividing conversions by users, because that's who you want to take the action. Think sales, or email signups. You don't need a user signing up for your email list all 5 times they visit your site - it only matters that they sign up once."
Funnel visualization
With funnel visualization, one can monitor and analyze users' interactions with a website, which leads them towards a goal. Having well-defined goals and basic conversions in Google Analytics is necessary to understand various interactions, such as contact requests, downloads, sales.
One needs to define targets or select templates to use funnel visualization with Google Analytics so that different conversion paths and their monetary value can be recorded and displayed. Google Analytics captures the steps users take to reach a goal and visualizes this data with funnels.
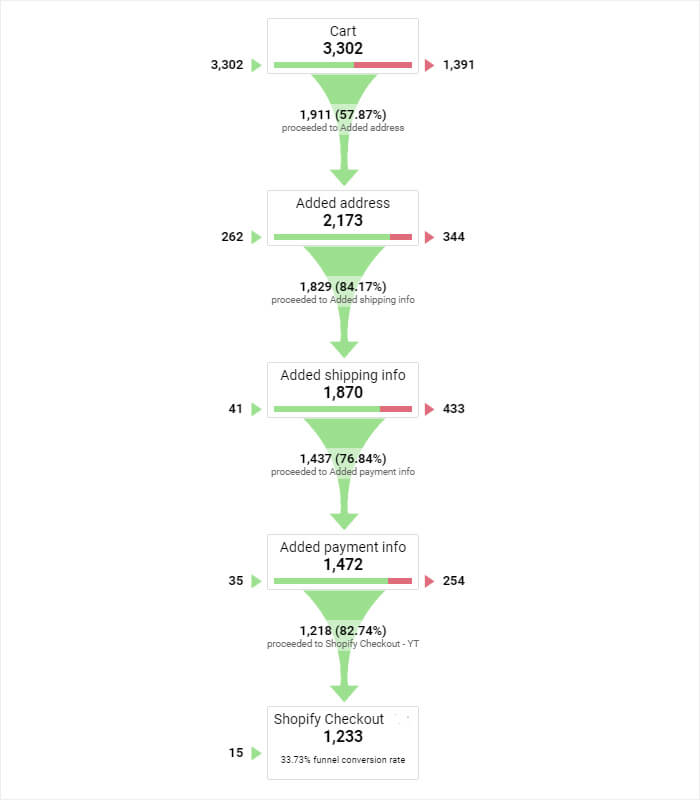
Crystal Diaz, Sr SEO Specialist at Xtractor Depot says,
"To visualize data, I recently started using conversions > goals > funnel visualization. This allows me to see where the customer is dropping off on our website. So let's say it's the checkout, then I'll go to the checkout page and see what the issue can be."
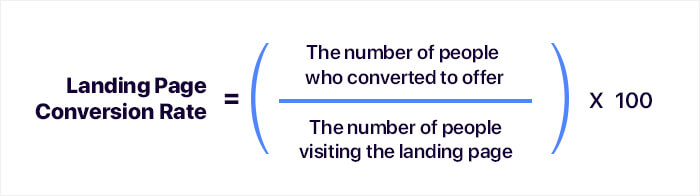
7. Landing Page Conversion
A landing page is any web page where you send "campaign traffic," meaning the click-throughs from your Ads and campaigns(PPCs, social media ads, or emails) to initiate a conversation and strike a deal.
To find Landing Page Conversion, navigate to
Behavior > Site Content > Landing Pages > GCR and Goal Completion
And the formula is:
Google Analytics is an incredibly powerful tool for measuring a landing page's performance and fine-tune any element if needed.
To make your landing page high converting, you need to present a single and focused call to action, eliminate distractions, clearly convey the value, and reduce friction. Video can also be used to boost user engagement.
An ideal landing page should warm up your potential customers and get them ready to purchase your product or service before sending them through to sign the deal. It must also capture leads for further communications so that you can market to them when they are further down the sales funnel. Tracking a landing page conversion rate helps you understand what parts of your landing page needs improvement, whether it is performing well and is worth the time and money to keep using the page.
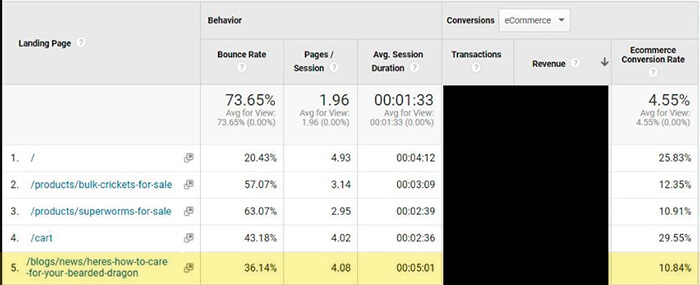
The most important metric for Jeff Neal from The Critter Depot is landing page conversions that measures which landing pages convert organic traffic into paying customers. Giving an example, he says,
"Our in-house zoologist wrote an article on bearded dragon care. We didn't think much of it, other than it was going to be useful for some of our visitors. But we started seeing more sales come through. When we started digging through the data, we realized that the organic traffic that was interested in our care guide, was also interested in buying roaches. So we started writing more thorough care guides on other reptiles, which has yielded the same results."
As you can see, the 'dragon care' article has a 10% conversion rate, and only a 36% bounce rate.
8. Assisted Conversions
Not many users purchase products or services on the first visit to a website. In online commerce, visitors generally go through various information gathering steps and comparison shopping, resulting in multiple visits to a site through different channels. So, to get a complete picture, one must know which channels are contributing significantly to a site’s success, but not get accounted for within the normal conversion numbers.
Assisted conversions is Google’s approach to measuring every interaction with a page that leads to a conversion despite not being the final click. Assisted conversions can be broken down by aspects such as campaign, channel, and several other dimensions to help analysts determine the factors that contribute to the overall conversion path.
Google defines assisted conversions as the number of conversions and sales the channel assisted, where a channel appearing anywhere—other than the final interaction—on a conversion pathway - is considered an assist for that conversion.
Kaspar Noé accepts that assisted conversions in Analytics has helped them tremendously with what channel helped reach most conversions.
"Through this insight, we were able to optimize the best converting channels and reach a 1640% increase in sales for one of our clients in the period from August to October 2019."
.jpg)
Assisted conversions in Google Analytics
A value is assigned to these Assists based on the transaction they contributed for, giving value to their contribution. The last click is the very last interaction that visitors have before they convert. You can find plenty of data on assisted conversions from the "Attribution" and "Multi-Channel Funnels" under the "Conversions" tab.
If you discover that one channel assists more than it converts, you can view "Top Conversion Paths" under "Multi-Channel Funnels" to find out what converting channel often works with that assisting channel. And if there is any pattern, you can think about creating campaign content consisting of those two channels.
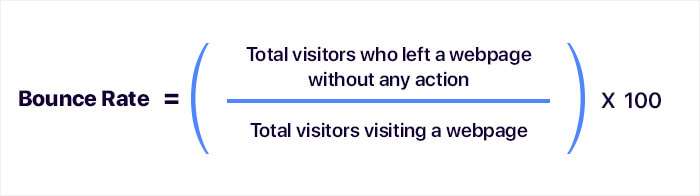
9. Bounce Rate
In Google Analytics, the bounce rate is the percentage of single interaction visits to a site. In other words, the bounce rate is a metric that measures the percentage of people who visit your website but triggers no action, such as leaving a comment, clicking on a 'read more' link, a menu item, or any other internal links on the page. A bounced session has a 0 seconds duration.
There are some places where one can find 'Bounce Metric'
- To see which pages have lower/higher bounce rate
Behavior > All Pages > Bounce Rate
- To find out the type of traffic that has the lowest bounce rate
Acquisition > Channels > Bounce Rate
- To know which mediums have the lowest bounce rate
Acquisition > All Traffic > Source/Medium > Bounce Rate
- To determine how your Adwords campaign fare regarding bounce rate
Acquisition > AdWords > Campaigns > Bounce Rate
The formula for the 'Bounce Rate' is:
Visitors may bounce off by clicking on another website's link or the back arrow that takes them to the previous page, by entering a new URL, or by closing the browser or tab. Users not engaging beyond the initial entering of the website is not necessarily an indication of poor website performance in every case.
High bounce rate can indicate three things, the poor page quality; the audience is not relevant to what you are offering; visitors have precisely found what they were looking for. Refining how the metric is being measured is one way to reduce the bounce rate.
Alex Chenery-Howes maintains regular posting of quality content that prompts visitors to explore the rest of the website or make a sales inquiry.
"With one of our clients, a software company, we found that bounce rate via organic traffic varied based on different 'angles' we took in our content. We believed that tying in the blog subject with our company's product would prompt users to request demos, rather than writing a simple one-line call to action. Ensuring our content targeted users at certain stages of the purchase cycle meant that we were meeting the needs of those with transactional intent."
Though a good bounce rate may vary for different sites and target audiences, for many industries, a higher bounce rate indicates that a website is not performing upto the mark and has flagging issues that must be addressed soon. Looking at analytics to identify the diverse traffic sources can help recognize where your website needs improvement.
To check the bounce rate of your website, select the "Audience > Overview" tab, then choose whether you wish to read the entire website’s bounce rate or its individual pages. To find the entire website’s bounce rate, click on the bounce rate metric that will also provide a graph for the designated time period, which can be changed and customized.
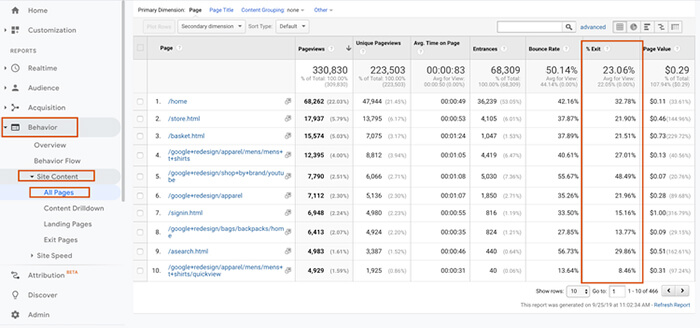
10. Exit Rate
Some people consider the bounce rate and the exit rate to be the same, but that is not the case, of course. An exit rate metric measures the percentage of visitors that left the website from a specific page. They might have visited other pages too before exiting. So, all bounces are exits, but not all exits necessarily are bounces.
To find out the Exit Rate, navigate to
Behavior -> Site Content -> All Pages

Dinah Adams, Communication Research Analyst at Futurety analyzes exit rate for landing pages of organic search users for having insight into whether the content they are producing is relevant to searchers.
"For informative blog content, a high exit rate can actually indicate that the searcher is dissatisfied with the information that they found. However, if the intent of the page is to drive users deeper into the site, a high exit rate can indicate that the content is not appealing to the users, or maybe ranking for less relevant search terms."
Though, a high exit rate cannot be considered a poor sign every time as it might merely indicate that the user found what they were looking for and so left the site. In a paginated article, it is quite natural for the last page to have a high exit rate. However, a high exit rate for some particular pages implies an issue in the conversion funnel.
When you find a page having a high exit rate, you need to determine why people are leaving. Is it because of the distracting content, slow loading speed, poor UI/UX, navigation issues, or anything else? After revisiting your conversion funnel and resolving the issue, you must give a reason to your users to stay. Ultimately, the exit rate is a very crucial metric that lets one find opportunity areas to optimize.
These are the 10 most important metrics that every business analyst and the executives must go through to get valuable insights for making quick and accurate marketing decisions.
Meanwhile, as the world has adjusted to the coronavirus pandemic since the last few months, Yaniv Masjedi, shares how they've seen shifts in organic traffic to a lot of their B2B content.
“You can see that anything related to remote work or staying connected is up. But a lot of other content is down a bit. That makes sense given the current environment. But by confirming it with data—instead of just making assumptions—I have a much clearer view of what to expect from a marketing and sales perspective over the next weeks and months.”
- Yaniv Masjedi, CMO at Nextiva
Conclusion
Grafton Robinson believes Google Analytics provides a wealth of information for digital marketers to use, but the biggest step that marketers can take is to set up appropriate goals for their site.
"Site content should target users at all stages of the marketing funnel and should be judged independently. If you're judging blog content by how many purchases come as a direct result, you'll likely be disappointed. Considering what you want each aspect of your site to do, and measuring it against that target, is the best metric for marketers to track."
With a large audience of potential customers via the Internet, every aspiring business should be utilizing digital services to optimize websites for SEO. And Google Analytics, which is an essential feature in fine-tuning SEO campaigns, has become an indispensable tool for almost every market analyst to explore the data, uncover deep insights, improve their growth strategies, and gross margins. Few limitations that Google Analytics has can be compensated by its capability to integrate with other data tools. This surely makes GA stand out amongst the other analytics management platforms. When more and more businesses are going online, and one has to compete against a lot of websites vying for the customers' attention, the importance of Google Analytics can only increase in the world of SEO.
There are 10 more metrics, which are also essential to get a genuine picture of your multi-channel efforts and to have a far more accurate view of the success that your efforts are delivering. Go through 10 Most-Tracked Google Analytics Metrics : Experts' Survey - II and get the complete picture!