Regardless of the industry, a business's online presence has a massive impact on its success. With proper SEO techniques, an organization can optimize its website and rank higher on Google SERPs. Google Analytics helps analysts track visitor engagement, provide an overview of all channels, measure the results of individual marketing campaigns in real-time, compare the data to earlier periods, etc. As we have mentioned in the previous part of the research, Goodfirms surveyed 80+ Marketing Experts worldwide to discover the most important Google Analytics metrics that businesses must analyze to have an extensive understanding of the visitors on their website.
Equally Important 10 More Google Analytics Metrics
In a digital age, even small businesses need a strong website marketing strategy as more and more consumers are engaging with brands online before making a purchase. And every marketing campaign on the Internet must be tracked to make it successful. That is why Samantha Russell who is Chief Marketing & Business Development Officer at Twenty Over Ten says,
"We tell our clients it's so important to consistently track your Google Analytics so you can figure out what is working for your website and marketing strategies and what needs to be tweaked a bit."
Given below are 10 more metrics that are also crucial to get a genuine picture of your multi-channel efforts. By analyzing them, you can identify any issues your website may have and then find a solution.
11. Demographics
When users visit your website, demographics reports can compile information about them, such as their age or gender, which is essential to ensure you are bringing the relevant traffic to your site. Because if your website is not attracting the right visitors - the ones who make up a large share of its traffic, no matter how effective the site is, users will not convert as it was designed for a different demographic.
To find demographics, navigate to your view, open reports
Audience > Demographics > Overview
By analyzing the demographics, you can make informed decisions about products, types of content, and offers to publish on your site. To deliver what users find useful is a definite way to convert them into customers. Besides, this also helps you build an authenticated image for your business.
Different demographics prefer different devices. Using a particular combination of metrics, you can know demographics preference and accordingly can drive marketing efforts in the right direction.
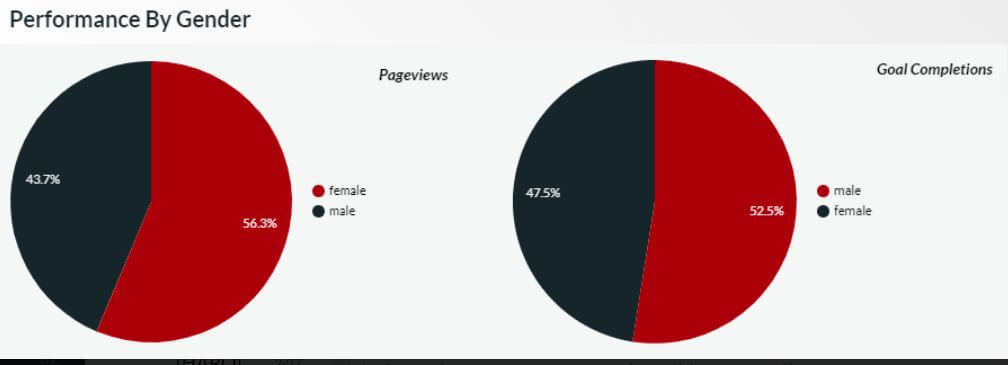
Lane Rizzardini, Owner of Marion Relationship Marketing, gives a good example of visualization of metrics from Analytics that has helped them with a private jeweler specializing in custom engagement rings.
"A majority of our traffic is from women on mobile devices. However, the vast majority of conversions come from men on desktop computers. Rather than exclude women and mobile phones, we use this to understand the likely journey: that women are doing the research and telling their boyfriends what to buy. So our top of the funnel advertising (such as Facebook) is geared towards women and tailored to mobile devices, while our Google Ads and other bottom of the funnel ad campaigns are geared towards men."
13. Keyword Ranking
Major search engines evaluate your specific keywords and position them accordingly. It is better to have your website ranking higher for high volume keywords. Clients directly correlate keyword ranking with SEO success making it an essential KPI. By improving keyword rankings with on-page and off-page optimization, one can rank on the top of Google SERPs and ultimately achieve other primary objectives, such as more traffic, leads, and sales.
Not many people are aware of using Google Analytics to track their keyword rankings. As we mentioned earlier, Google Analytics is a great tool, but it can work even better for certain things when combined with other Google Webmaster Tools.
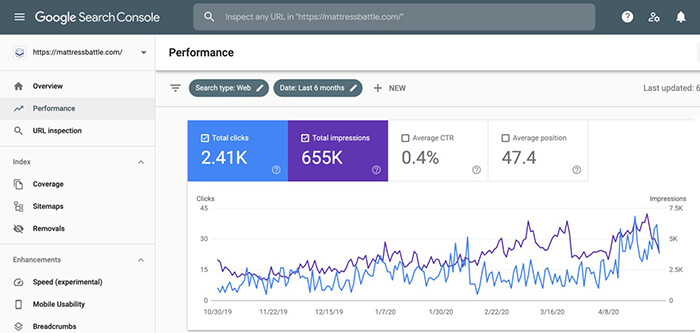
With GA, Mason Culligan, Founder at Mattress Battle, monitors keyword rankings as it is closely related to sales.
"Tracking your sales is vital to gauge the effectiveness of implemented business strategies. For this, using Google Analytics in conjunction with Google Search Console is the best solution because it allows me to determine keywords that are not performing well. Taking the initiative to monitor and understand underperforming keywords helped me mitigate the problem and come up with a solution."
Capitalizing on your existing success is advisable. Find the best high-converting keywords for your website, and continue using them in the content marketing campaign. These top-ranking keywords generally drive more traffic, so ensure that the landing pages are associated with the keywords, which help in keeping the bounce rate low.
There are other tools in the market, which are widely used for keyword tracking, such as Moz, SEMrush, Ahrefs, etc.
14. Clicks and Impressions and Events
Clicks and impressions are a means of measuring the effectiveness of your advertising. When your ad gets loaded and displayed before a user, that is one impression. And when a user actually clicks on it, you will have one click. Being the basic unit of measurement, clicks are more important than impressions. But to get it clicked on, users first need to see your ads, so the impressions have their place too. What makes clicks more important is, all clicks have the potential to lead to conversions.
Events are user interactions with content, which can be measured separately from a screen load or a web page. You might want to measure some actions, such as downloads, gadgets, mobile ad clicks, Flash elements, video plays, as Events.
To analyze clicks or impressions in Analytics, navigate to your account and go to
Behavior > Events > Top Events
Once ad impressions or clicks are tracked, look at Advanced Ads in the Event Category list to have the number of all clicks and impressions in the given period.
Adam Lumb, EN Site Manager at Cashcow Media, gives us insight into clicks, impressions, and events.
"If I had to choose one metric that's the most important, then it would be Clicks. This is because I can immediately compare Clicks over time to see if a page is driving more or less traffic. However, Impressions play a big part too (for example, we have seasonal periods where the number of Google searches are lower), so CTR is useful for understanding whether any drops or increases in traffic are due to your page's performance. Our site also offers a variety of products, so the Events metric is very important too. This indicates what products are doing well on specific pages, so we can shuffle these around based on data to optimize the conversion rates."
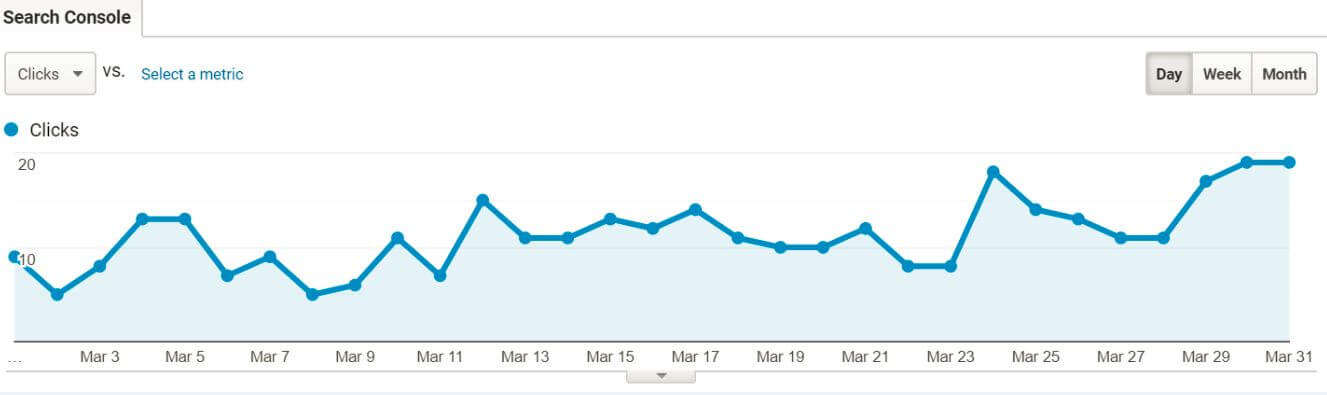
The image shows the number of daily Clicks for Adam's article throughout March. By looking at the graph, we can see that the average number of Clicks increased during the second half of the month compared with the first.
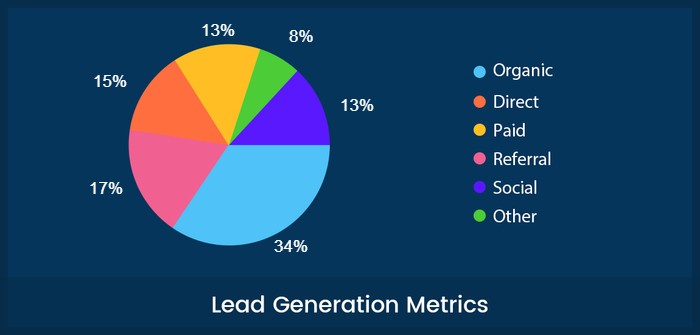
15. Lead Generation
With a plethora of information available online, it has become difficult for brands to stimulate and capture the attention of their targeted audiences. But they can solve the issue by conducting an extensive lead generation campaign. That is why marketing professionals are increasingly integrating lead generation into their work responsibilities as a crucial aspect in sales and marketing. Anything from business leads to newsletter signups to university enrollment can be included in lead generation. And for a lead generation site, it is advantageous to create goals in Google Analytics.
To view form conversions,
Behavior > Events > Overview
If a website owner's end goal is increasing qualified leads, they need to monitor visitor activity, assess web browser popularity, understand visitor flow, locate bounce pages, mobile users/desktop in their Google Analytics.
When a lead-generation website is supported by paid advertising, one must attach a value to each lead to let Google Analytics know the worth of leads for the business.
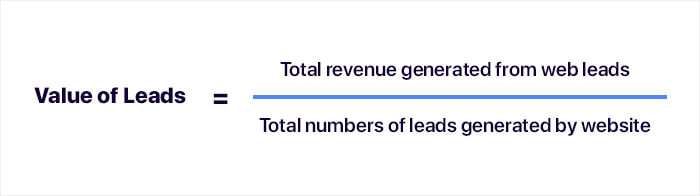
By setting up lead source tracking on a website, one can gain insight into which campaigns drove the majority of leads, which is imperative to access the value of the lead generation campaigns.
Manish Dudharejia, Founder & President of E2M Solutions Inc., considers lead metric as the most valuable metric to their company. He reasons,
"It tells us how well we can draw interested traffic and allows us to take a deeper dive into understanding which leads are actually qualified. Without understanding how many leads we're getting and what kind of value they offer, we would struggle to implement the best sales and marketing strategies."
A company that wants to grow and expand the reach must keep track of visitors. So, one needs to understand how each of the lead generation forms is performing on a website. Analysts can automatically track multiple form conversions as events, without bothering with code and manual goal setup by using Google Analytics with an add-on.
16. Behavior Flow
User behavior - the journey they take through the website to interactions - is complex and varies across different sites depending on the target audience.
To locate the Behavior Flow report - navigate to your view, open Reports, and
Behavior > Behavior Flow
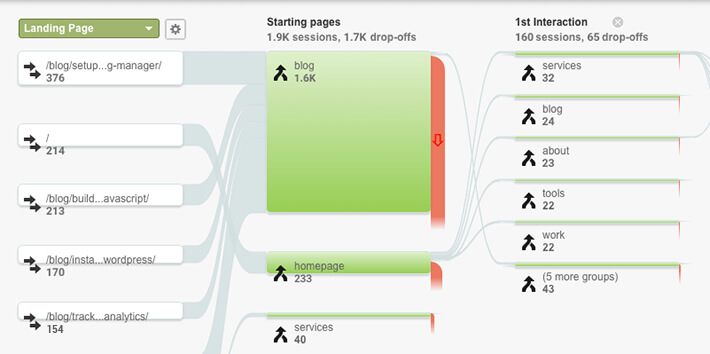
This chart demonstrates how the users move from one page to another on a website, what actions they perform while navigating, the length of time visitors spend on a site, and the final destination they visit before bouncing off. So, by researching online behaviors, analysts can have an idea of what users are gravitating towards or ignore, where they experience friction, get confused, and leave, how specific sections and pages are performing, what persuades them to convert, etc.
According to Elly Wilson from Trendz Plus, behavior flow is the most significant metric to track.
"On our website, we have multiple categories, and each category has many pages. A person visiting one page may navigate to another page which helps us to understand what kind of information a user is looking for. It also helps us in understanding bot visitors since they have a different behavior flow than normal visitors, which is very erratic."
The visualization of the path users traveled gives you a firm understanding of the visitor's thought process, so you can influence them to go down the paths related to your objectives. Consequently, you can optimize the entire interface by adding, removing, or re-arranging CTA buttons, make smart decisions on the reorganization of linking strategy, boost conversion rates and improve the overall effectiveness of the website.
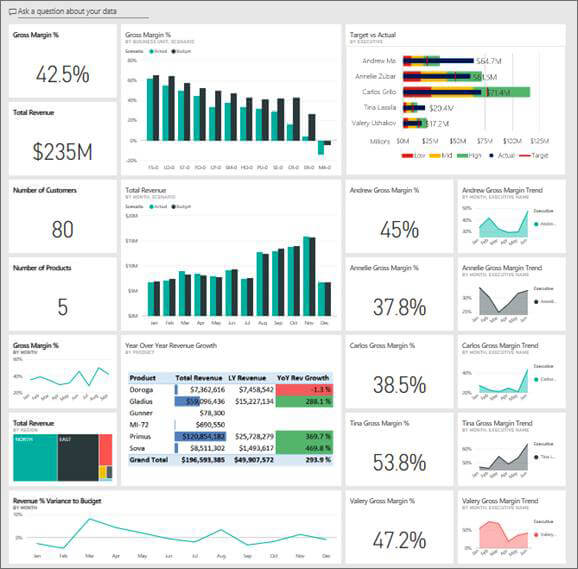
17. Revenue
Beyond being a lifeline - revenue - the total income that normal business operations generate, including discounts and deductions for returned merchandise - gives one remarkable perception about their businesses. In Google Analytics, Revenue is available on the Ecommerce Explorer tab of many standard reports.
To see eCommerce-specific reports:
Sign in to Google Analytics, go to your view, open Reports and
Conversions > Ecommerce > Overview
With Google Analytics, analysts can also calculate the revenue brought in from each marketing channel.
To see traffic from each channel and revenue generated from each medium and source, navigate to,
Acquisition tab > All Traffic > Source/Medium
Businesses should look at revenue by traffic source, demographic, and location; and should optimize buyer personas and adjust ad spend accordingly. There are several Revenue metrics that one should dwell into for having in-depth knowledge of what is working and not working in a company's overall sales efforts. For example, Revenue per Session, Revenue per User, Monthly Recurring Revenue(MRR), Revenue per Visitor (RPV), etc.
Joseph Piñeiro, SEO Manager at 360training, considers tracking metrics like close rate, cost per acquisition, and churn rate as essential, but is firm that revenue must be your ultimate metric for gauging success. He informs,
"Not only do we track our revenue hourly against the previous year and our goal of 15% growth year-over-year, we meticulously document it by site and medium. This enables us to quickly identify the problem when sales are down and react accordingly."
Analysts must turn on Enhanced Ecommerce to view The Sales Performance Report to evaluate revenue and overall sales within a defined period of time and to know total revenue.
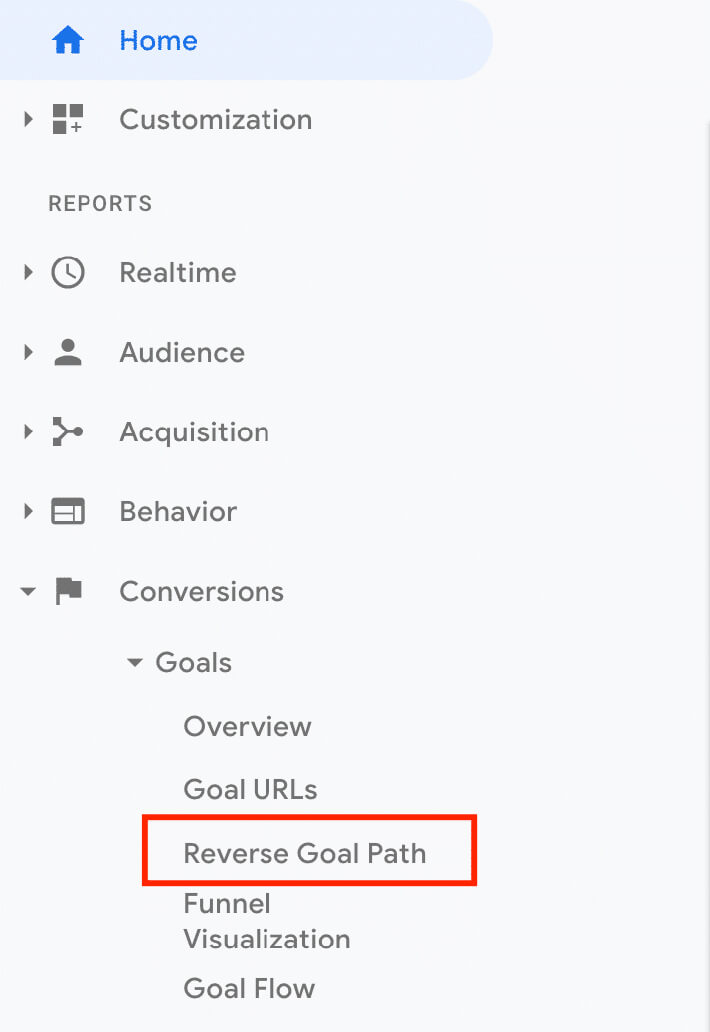
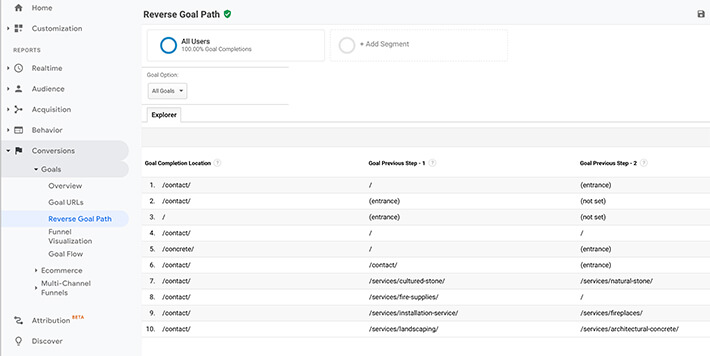
18. Reverse Goal Path
The Reverse Goal Path Report retraces the customers' journeys to a goal destination page and shows the number of conversions generated by each path. One can select individual goals for more specific analysis in the report and can also review the overall goal completion paths.
Access the Reverse Goal Path report by navigating to
Conversions -> Goals -> Reverse Goal Path
By default, this report presents data from all Goals tracked within the Analytics view. While tracking multiple Goals, analysts should take time to zero in on the pathways for each Goal.
This report is even more useful when the user can follow multiple paths to complete a goal or to convert. It provides answers to how customers navigated while performing an action that you have configured as a goal, what was the preferred route, which path led to more conversions, what other pages they visited just before conversion.
Lance Beaudry, Co-owner of Avalanche Creative, regards Reverse Goal Path as the most important metrics in Google Analytics.
"This allows us to see true results (leads, sales, form clicks, etc.) from organic traffic and the content (pages on the website) the user interacted with before taking the desired action. This allows us to identify opportunities for improvement and show clients that content we are publishing is impacting the business."
After analyzing the report, you can optimize the pages that drive more conversions. By applying segmentation to your Reverse Goal path report, you can have more granular insights.
19. Return on Investment
Despite providing a rough measure of an investment's profitability at times, Return on Investment is a standardized, universal, and a significant analytical tool used by both investors and businesses.
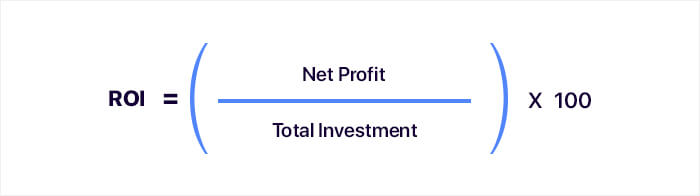
Simply put, ROI is a ratio of the profit from an investment relative to its cost. It is useful in evaluating the potential return from a stand-alone investment and also in comparing returns from several investments.
Without this metric, it is difficult to know where one's time, efforts, and money can be best-placed. To use ROI metric in Google Analytics -
- Link Analytics and AdWords if you're running Google AdWords ad;
- Set up custom campaign URLs if you're running paid ads outside of AdWords;
- Import cost data into Google Analytics;
- Set up an inquiry spreadsheet and fill out the values of previous inquiries if your primary focus is lead generation;
- If you're running an eCommerce store, set up Google Analytics E-commerce Tracking.
Andrew Gillespie, Director at Paramount Digital is of the opinion that having good traffic is always appreciated, but it is more necessary to convert this traffic into sales or leads. He informs,
"The most important metrics for us is ROI (Return on Investment). We segment our reporting, so our clients can see their revenue and costs from each marketing channel: Organic Search, Paid Search, Social, Referral, Direct, Email. We then display our findings in Google Data Studio."
To analyze ROI is essential to every business as it justifies the work one has done, it shows what works and what does not, and it allows to set targets moving forward.
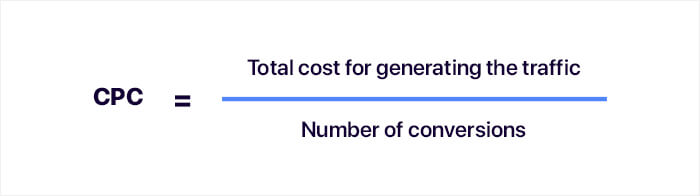
20. Cost per Conversion(CPC)
Cost per Conversion(CPC), sometimes known as Cost Per Action (CPA), should not be mistaken with Cost per Click. For advertisers in PPC Marketing/Online Marketing, CPC is an important metric. Cost per Conversion shows the amount it actually costs to acquire a real customer who makes a successful conversion. It lets you know how successful an ad is in achieving its goal based on the total cost of that ad.
Cost per Conversion metric in Google Analytics can be found under the Adwords section.
The formula for Cost Per Conversion is:
Providing insight into his favored metric, Elmer Taboada, Marketing Manager at DaVinci Tech, says,
"The best metric we focus on is the cost per conversion, which tells us the amount of money we spent per person before they convert. The higher the cost per conversion value, the more we hustle to invent ways to bring the value down."
Additional Web Analytics Metrics
There are some other metrics, which must be analyzed to have more insights into your data.
1. Google Analytics Segments
A segment is a subset of data within the scope of Google Analytics to let analysts isolate and analyze those parts of large data for examining and responding to the component trends in business. Within the GA interface, segments can be applied to any report. There are three segment levels in GA - User, Session, Hit(pageviews, events, and transactions). GA provides many predefined/default system segments to allow businesses to start using them for analysis right away. But you must check the list before creating your own segments to ensure the one you need is not already available.
Simple segments include demographics, technology, behavior, session, traffic sources, etc., but as they are pretty generic, you can use custom segments, where you can apply your conditions and logic.
To create a Google Analytics segment, you need to look for the "+ Add Segment" at the top of Google Analytics. Under "View Segments," you will find the options available for segments, such as All, System, Custom, Shared, Starred, Selected, etc.
Matt Slaymaker at Perficient, is keen on using Google Analytics Segments to compare which landing pages are working best for their email campaigns.
"It's less a metric, and more a feature of Analytics that allowed me to open a door into deeper analysis. This feature is Google Analytics Segments, which allow you to group users by a condition, or a particular combination of conditions. Want to analyze how 18-29 year olds behave on the website? Simply create a segment for this group."
Segments are applied to factual data, and they do not permanently alter your data. An additional row is added to your report for each segment that you use in Google Analytics. So, you can review measures of volume, engagement, and value generated. Then you can compare them to other segments or the whole website to determine why some segments perform better than others.
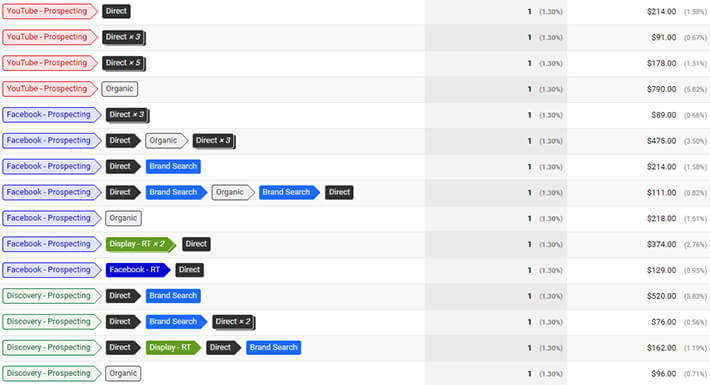
2. Multi-channel Funnel(MCF) Report
In Analytics, conversions and eCommerce transactions are credited to the last search, ad, or campaign that the user referred to when converting. But it would be short-sighted to take the business decisions based only on last-click performance data. Analysts must know what role prior website referrals, searches, and ads play in that conversion.
The Multi-Channel Funnels reports show how your marketing channels work together for creating sales and conversions. That is why these reports are useful for any business that has multiple sources of traffic to their website. Ultimately, Multi-Channel Funnel data is a cross-section of data that allows you to examine conversion paths from your website. Setting up goals or eCommerce tracking are prerequisites to enable the MCF reports in Google Analytics.
Default 30-day lookback window(that can be adjusted to maximum 90 days) on conversion is provided in the Multi-Channel Funnels reports. Google Analytics provides five standard reports for everyone to access.
To find Multi-Channel Funnels reports, navigate to your view, open Reports
Conversions > Multi-Channel Funnels > Overview
John Lincoln, Co-Founder, CEO at Ignite Visibility, likes looking at Sources Report to track new visitors, conversion rates, conversions, and get a bird's eye view of their entire online business model. He says,
"We use Google analytics to review every source of traffic, how it hits the website, and how likely it is to convert. If you can see this, you can understand the entire online business model. This is so powerful. You can take it a step further and look at the multi-channel funnel report. It allows you to see traffic that touches the website multiple times. By using these reports together, you can understand how to scale and refine your online model."
John also advises to look at your top landing page report, your top exit page report, your behavior flow report, and mobile vs. desktop report. He asserts that by analyzing them, you can have a good understanding of the best pages, worst pages, how people move through your site, and use devices.
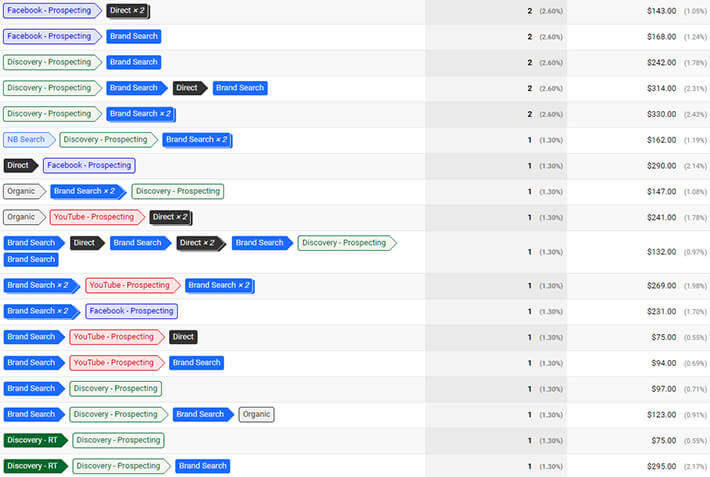
3. Top Conversion Path Report
The Top Conversion Paths report lets you know the conversion paths that customers took on their way to purchase. You can view unique conversion paths (the touchpoints within the buyer's journey), leading to conversions, the number of conversions from each path, and the value of those conversions.
If you find repeated patterns while looking through the list of paths, you can identify your most popular referral paths and know how to cross-market most effectively across channels. The top conversion path reports, by default, shows conversions and conversion revenue data. By applying conversion segments to your report, you can view click-through and view-through data.
To find the Top Conversion Path report,
Conversions > Multi-Channel Funnels > Top Conversion Path
Ruslan Shogenov mainly uses the "Acquisition" report and everything that this report includes: Google Ads, Google Marketing Platform, Google Search Console, etc.
"But my favorite reports in Google Analytics are the "Assisted conversions" and "Top conversion paths" reports - this data is also necessary to understand which traffic sources affect user decision more, and how many interactions the user needs to complete the target action. Using this data, we can improve communication with a specific audience."
- Ruslan Shogenov, Product Marketing Manager for SEO toolkit at SEMrush
Ruslan Shogenov believes that to make the right decision on the efficiency of a particular channel or type of communication; you need to aggregate and analyze all available information.
"I try to look at various metrics to make the right decisions; for example, analyzing the effectiveness of a display or video ad, you have to look not only at the click-through conversions but also the view-through conversions and analyze user behavior and the number of interactions with your product."
Conclusion
To survive the fierce online competition, you need to have an effective digital marketing strategy. By tracking essential metrics that cover all business aspects with Google Analytics, you can monitor the effectiveness of your online marketing strategies, user experience, device functionality, and onsite content. Learn to analyze informative Google Analytics graphs and make a breakthrough in the competitive digital marketplace! When you identify any issues, the site might have, implement the solutions immediately and ultimately increase the conversions.