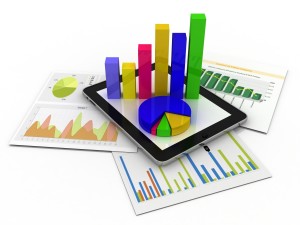
Optimized reporting platforms are extremely important today. Reporting tools are helpful to present factual, and reliable data in visually understandable formats. Charts, graphs, and tables used in the intelligent reporting software allow the data presentation to be in the preferred format. Traditional reporting formats have almost become obsolete. Advanced reporting systems using some of the best AI-backed reporting software solutions enable businesses to increase communication and accuracy and make well-informed decisions easily.
More and more business organizations are now turning to business intelligence, artificial intelligence, and advanced reporting software programs for growth; hence, the market for such tools is significantly expanding. Many of the global businesses rely upon automated software programs for their official report management. It is due to highly designed documents, ease of implementation, and accurate & precise reports. Around 19.86% businesses rely on open source analytics and reporting software solutions, which is an increased amount of percentage from the past decade.
This article can guide you on the role and importance of reporting software solutions for businesses using some of the best open source reporting software programs.
Reporting Software Program
A reporting tool is a business intelligence application suite. Its primary purpose is to transform the available data into actionable information. The data compiled is eventually structured into specific reports. Actionable information provides any business an immense power to make appropriate business decisions.
Different Types of Reports
Reports may vary due to their instructiveness. Let us check out different types of reports that the users can generate using advanced reporting software programs.
- Formal or Informal Reports: Formal reports are more objective, detailed, carefully structured and are written in a professional style. Informal ones are natural and casual in terms of the language used. They are usually short in size.
- Long or Short Reports: This feature doesn’t have many characteristics. A one-page memorandum makes it a short report, whereas a 15-20 page report is a long report.
- Informational or Analytical Reports: Informational reports can include monthly financial reports, annual reports, employee attendance reports and all that covers figures, data or information of any type. Analytical reports are a bit different to them despite involving facts and figures. They include real-estate appraisals, feasibility reports, scientific research reports, etc.
- Proposal Reports: A proposal document is prepared as a problem-solving report. It describes how one organization can help the other in meeting their needs within their budget and time. Most government advertisements issue “requests for proposal” or RFPs specifying their needs and the requirements of the proposal reports from their potential suppliers.
- Lateral or Vertical Reports: This type of classification most significantly refers to the travel directions of a report. The reports created upward or downward the hierarchy are vertical reports and are meant to contribute to the management control and help in organizational coordination. On the other hand, the report traveling between different units in the same organization level comes in the category of lateral reports.
- Internal or External Reports: Reports that travel within the organization are internal reports and those prepared for distributing outside the organization such as annual reports of companies are external reports.
- Periodic Reports: Reports that are scheduled to be presented on some regular dates or schedules are periodic reports. They are generally directed upward and belong to management controls. Computer-generated reports and pre-printed data forms are few examples of periodic reports.
- Functional Reports: These are generic kinds of reports, including financial reports, marketing reports, accounting reports and a variety of other reports. They are also classified as:
- Pre-printed forms
- Memo
- Letters
- Manuscript
9. Industry Reports: These types of reports contain industry-specific valuable information regarding the KPIs, goals and objectives of the organizations. It may also include geography specific information pertaining to organizational growth.
What constitutes a report?
- A description of a situation or a sequence of events.
- Interpretation of the significance of the case or these events based on either your analysis or viewpoints of others as well.
- The result of your research or evaluation of facts.
- Probable outcomes with the future course of action
- Recommendations
- Conclusions
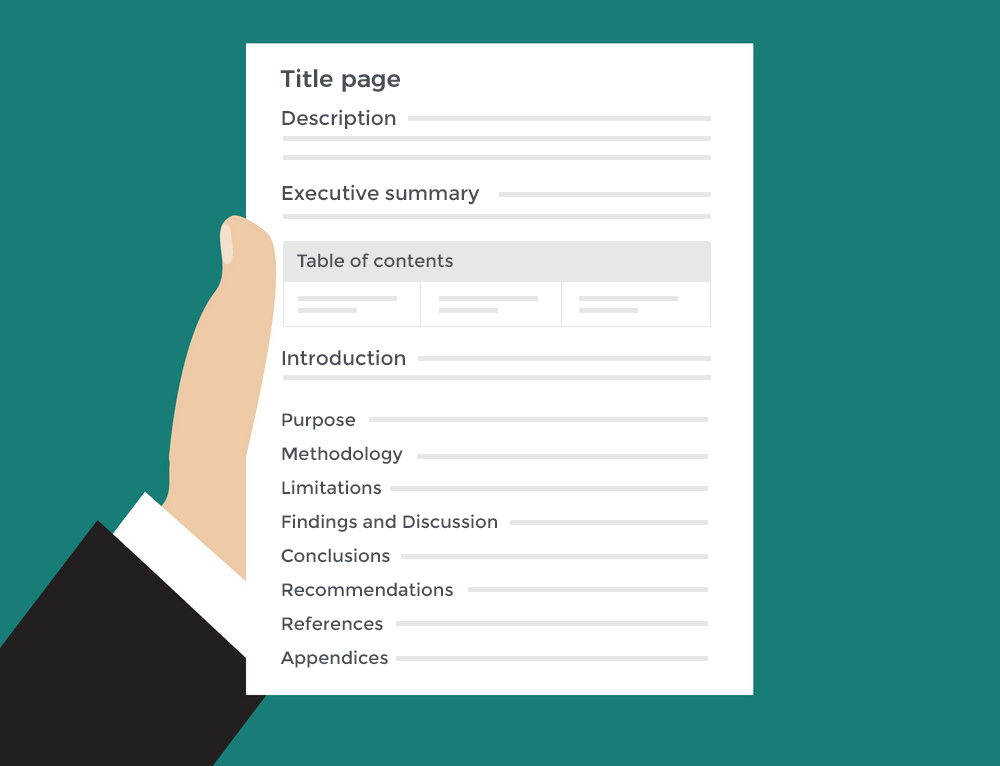
Structure of Reports – Standard Format
Evolution of Reporting
Surveys are the most initial form of reports. Surveying has been around for centuries. More specifically, they have been in use for 6,000 years based on historical records.
However, the first reporting process evolved with the cross-tabulation feature. This feature still prevails in the modern day’s reporting software systems due to one unbeatable quality, i.e., anyone can read them intuitively and without any instruction.
The concept of business reporting software emerged to perform the accounting and calculation functions during the 1960s.
During the 1970s, several companies came into the market with their innovations related to reporting software tools. Then in 1973, the first UNIX operating system was launched which paved the way for time-sharing and multitasking configuration - a base for reporting software programs.
SAP was launched in 1972 during the period of Enterprise Resource Planning concept introduced in the European market. The Intel 8008 that came in around the same period also helped in enhancing the features like handling letters of uppercase and lowercase, punctuation marks and symbols, and ten numerals. It has dramatically increased the usage of potential reports and other business reporting tools.
During the mid of the 1970s, Oracle, Apple and Microsoft companies made their strong entry into the world of reporting software programs. The first spreadsheet software program VisiCalc was released in 1979 for the Apple II computer.
For the business sectors, Green Bar Reports were in use during the 1980s which was the earliest applied forms of business intelligence.
The late 90s saw many reporting software companies introducing the open source and free reporting software programs as well. These software helped the users in experiencing a diverse style of reporting involving advanced data visualization and business intelligence techniques.
AI-enabled reporting and Geo-reporting are a widespread phenomenon of bars and charts-based reporting practices today.
Why are Reporting Software Solutions needed?
Microsoft Excel and PowerPoint are the best suitable solution for the majority of data related needs. But if you need a more robust, and extraordinary solution to meet the data related technicalities, reporting software is always best to choose. Digital reports from a reporting tool are 24/7/365 accessible and can easily be shared online via viewer access or public URL.
Here are the reasons that justify why reporting tools are best-to-have for an organization:
- In the context of Business Intelligence, reporting is one of the best components and it helps in visualizing data. The BI components like charts, graphs, tables, and other widgets help in presenting data in different styles.
- The non-technical decision makers can also utilize the ability of slicing, dicing and drilling down/through data, implement formulas and even perform some base level data modeling that was earlier the case with dedicated data scientists and analysts.
- Reporting software brings up the self-service or ad hoc reporting abilities in a user. The decision makers can eventually get the power to create and edit the report themselves to drive businesses forward and thus, the workload from the developers and report developers decreases.
- The enterprise-wide reporting capabilities risked many organizations to data overloading and analysis paralysis. Reporting software thus centralizes the reporting procedure across different departments and promotes ease of doing business. The administration process becomes more comfortable in this way.
- Advanced reporting capabilities facilitate pixel-perfect reporting, report scheduling and easy separation of the larger data sheets into separate pages for printing.
- Reports generated via reporting software can be easily shared by integrating it with file sharing software too.
- Reporting tools also help with data cleansing, improving the overall accuracy.
How Does Reporting Software Work?
A reporting software consolidates your business data, frees the up-time for valuable analysis and eliminates the tedious tasks of manual reporting that make your reporting time slow down. This type of tool is extremely helpful in making more strategic decisions – quickly and accurately. Let us check how these tools work in a procedural format.
- Entering of raw data into the databases and data warehouses for data recording.
- Requesting queries for data.
- Reporting software is set-up and connected to multiple data sources.
- The software then fetches data based on the user-submitted questions, and displays information in easy to interpret charts, graphs, and visualizations.
- The report is then evaluated and downloaded/printed as per the need.
If you need free and open source solutions, then below are the top free and open source reporting software solutions detailed for you.
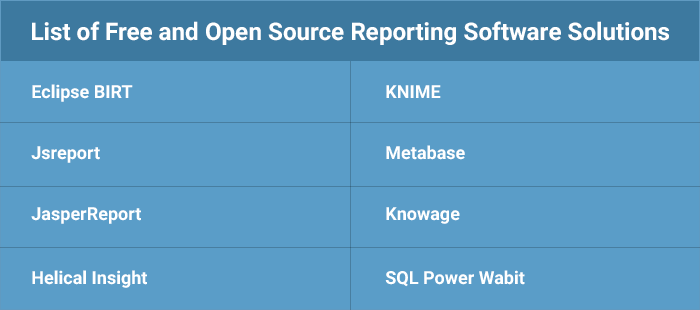
Free and Open Source Reporting Software Solutions
Open source reporting software programs can be installed quickly and integrated conveniently with any existing system. The source code of all the open source projects within a company is free to be utilized and primarily contributed by the users. These are well-maintained and time-to-time investigated by the open source community. They are low-cost or free software programs and work best when embedded with advanced reporting technologies.
List of the Best Free and Open Source Reporting Software Solutions
Let us check some of the best open source reporting tools that help organizations of all sizes in their reporting operations.
Reporting tools help you mine the entire business data for almost all the information. But all software programs do it differently.
If you want to know how different they are from one another, check out the comparison table given below.
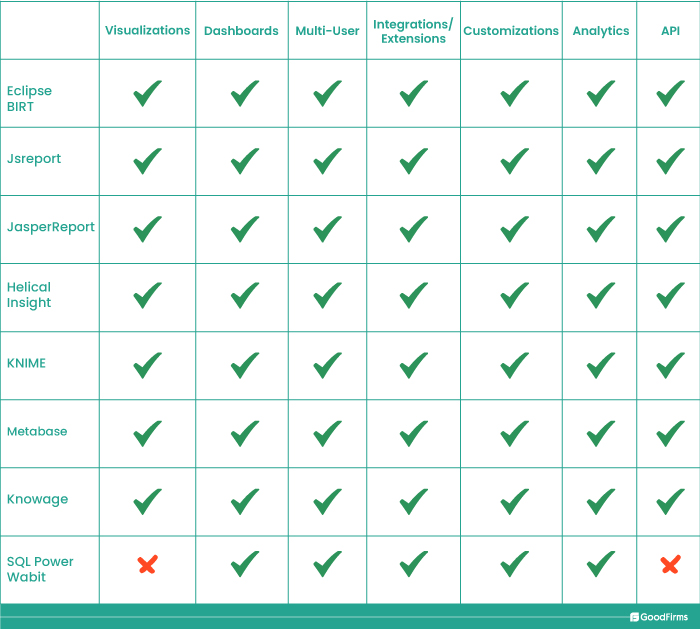
Let us check out these free and open source reporting software solutions in detail.
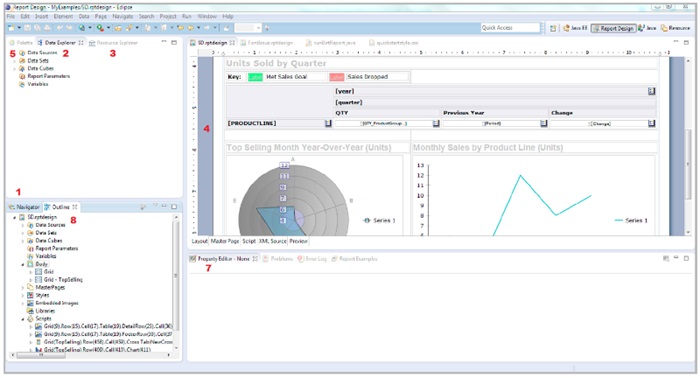
1. Eclipse BIRT
BIRT open source software project is well known for its rich features that enables better report generating capabilities to provide the astonished BIRT technology platform for creating reports and data visualizations that can further remain embedded to the rich web and client-based applications. The software is available on Java and Java JEE. The software is the creation of Eclipse Foundation and operates on cross-platform networks. The stable version 4.16.0 release date of the software is June 14, 2024.
Highlights:
- BIRT software possesses two components: a visual report designer to create designs and a runtime component to deploy those designs to any Java environment.
- The software facilitates data customization, conditional formatting, scripting, Java event coding, project management, styles, libraries, internationalization.
- The software is very extendable, and includes data access, report items, chart types and output formats as its extendable features.
- In-built templates
- View data in charts, lists, crosstabs, compound reports, etc.
- Property editor to view commonly used properties conveniently
- Resource explorer to reuse report objects
- Excellent built-in filtering features
(Source: Eclipse BIRT)
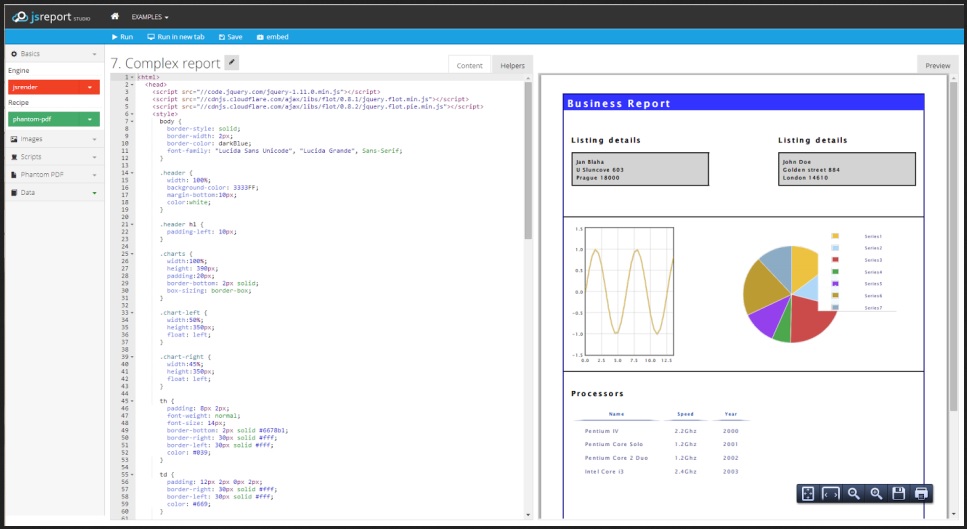
2. JSreport
Launched in 2013, the JSreport software is one of the top rated free and open source reporting software. Till now, it has crossed more than 200,000 downloads. The latest version of the software is 4.6.0 which was very recently updated in August 2024. It runs on multiple-platforms and allows the users’ to create reports on different formats like PDF, Excel, XML or HTML.
Highlights:
- The JSreport software owns the best templating engines for great dynamic layouts, full support for the latest CSS and Javascript and custom Javascript hooks for data fetching.
- It includes a web-based designer connected with a modern browser to design reports.
- It provides a complete set of extensions like templates versioning, scheduling, subreports, import-export, and backup and user management.
- Supports REST API, CLI or SDKs for report rendering
- Custom extensions, recipes and engines
- Dynamically generate rows and columns in pptx
- Generate nested tables with background color setting
- Recursive component rendering
(Source: JSreport)
3. Jasper Report
Jasper Report is one of the most powerful open source reporting engines. The software is available in Java, and it supports report documentation in any format including HTML, PDF, Excel, OpenOffice, and Word. It is a versatile tool to quickly generate attractive reports and data visualizations from raw organizational data.
Highlights:
- The fundamental purpose of the Jasper Report software is to create documents printing in the pixel-perfect presentation.
- The software features some facilities for Excel documents as well like grouping rows, freezing panes, applying formulas, stretching widths of the row, column and height.
- Users can easily embed contents from the external documents to the generated report.
- The row outline grouping on various indentation levels is another noticeable feature of this software program.
- Intuitive drag-and-drop reporting interface
- Supports self-service reporting
- Easily embed reports and dashboards into user interfaces
- WEBP images support
(Source: Jasper Report)
4. Helical Insight
A developer-friendly open source BI and reporting framework – Helical Insight is built on Java, HTML and CSS based platforms. Its structure also allows building functionalities and plugins using Java and HTML development. The community edition of the software is XML driven.
Highlights:
- Helical Insight software facilitates seamless connection to any database, custom-data source, APIs and flat files.
- It is 100% browser-based software that comes with an auto emailing feature for reports and dashboards.
- It supports multi-device and multi-tenancy compatibility.
- It uses both – traditional and modern methods for data analysis and embeds its BI solutions to your products.
- User role management for better security
- EFWCE Reports for complex report creation
- Unique Workflow rule engine to implement custom business processes
- New generation UI with one click access
- In-built email scheduling
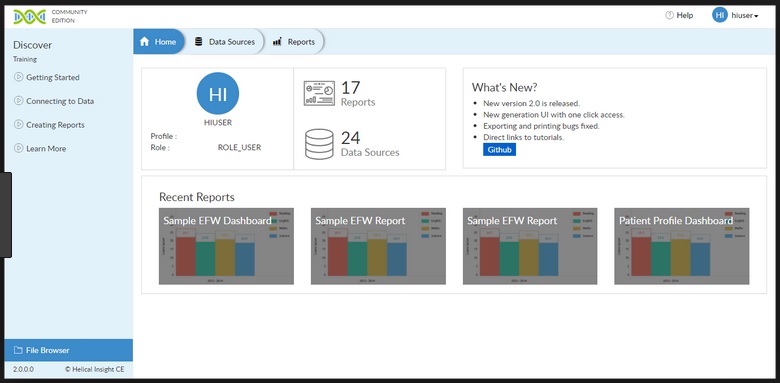
(Source: Helical Insight)
5. KNIME
As a product of advanced data science, KNIME is an open source, fast, easy and intuitive analytics platform and well known for being a data-driven reporting tool. Headquartered in Zurich, the software holds a vast community of developers and scientists in more than 60 countries of the world.
Highlights:
- KNIME is scalable software for sophisticated data handling.
- It provides an intuitive user interface and a well-defined API for plug-in extensions.
- It can run on multiple platforms and assures easy import/export of workflows.
- It offers more than 2000 modules or nodes for building your workflows.
- It supports different file formats like CSV, PDF, XLS, JSON, XML, time series data and unstructured data types, i.e., images, documents, networks, molecules, etc.
- Version history of workflows and components is available
- Offers automated workflows to eliminate manual data manipulation
- Centralized billing on team level
- User credential management to prevent unauthorized access
- Integration with corporate authentication providers
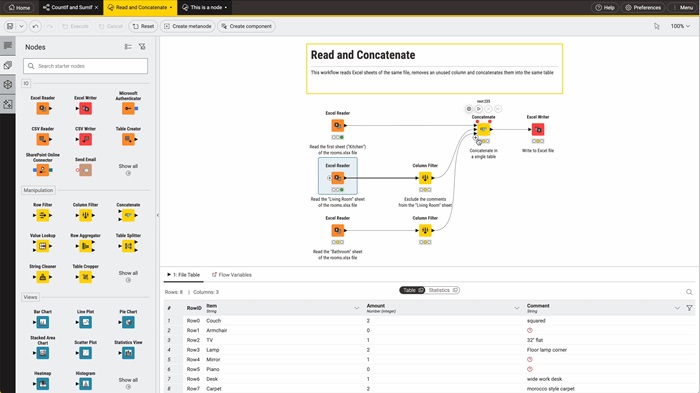
(Source: KNIME)
6. Metabase
Metabase is one of the easy-to-use, free and open source software that quickly filters and groups your information into the kind of report that you are looking for. The latest version of the software is v0.32.4. As per Predictive Analytics Today’s Survey, it got 8.1 user rating out of 10 ratings for its exceptional features and functionality.
Highlights:
- Metabase software allows for exceptional integration and performance facilitation.
- It facilitates an elegant SQL interface that makes it easy to dig into complicated stuff.
- The software dashboard allows the users to create, organize and share a collection of data.
- Users can also visualize data in the form of graphs and charts in just a click.
- It offers analytics dashboards with cross filters.
- It comes with a report delivery schedule and alerts through email and Slack.
- The software also comes with dashboard, collection and application permission for better control.
- 20+ database and data warehouse connectors and CSV upload are there for additional data sources.
- California Consumer Privacy Act (CCPA) compliant
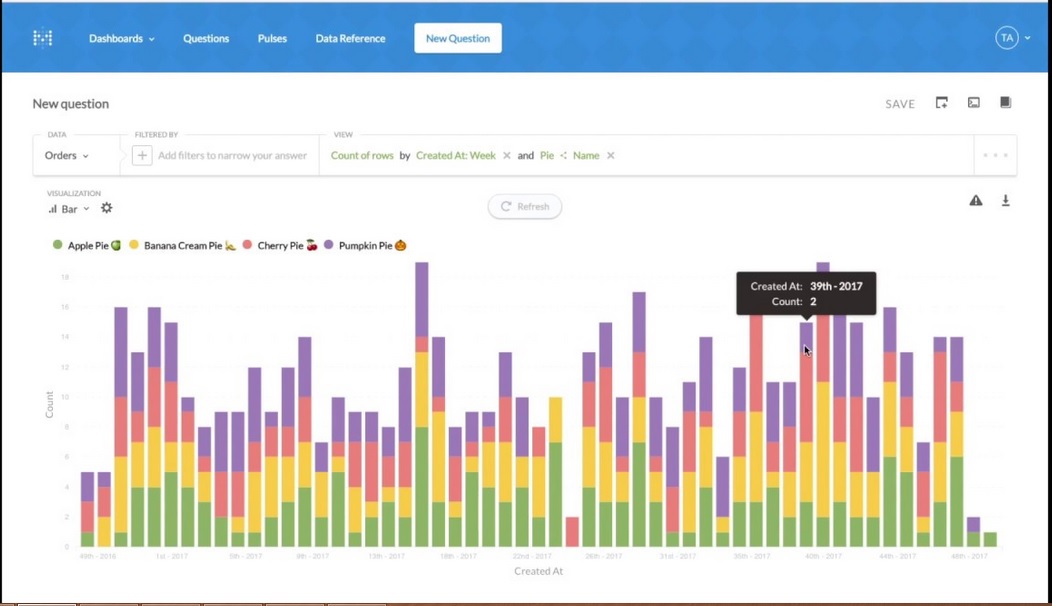
(Source: Metabase)
7. Knowage
Knowage is one of the best open source suites for modern business analytics. It is an improved version of SpagoBI, and its latest version is 8.1.26. The software provides the opportunity to work with traditional data sources and big data. Knowage software is used to build reports, interactive cockpits, and multidimensional analysis. It offers a wide range of analytics features, such as self-service data, data exploration, data/text mining, ad-hoc reporting, embedding analytics and data visualization, etc., making it a centralized and unique reporting software for businesses.
Highlights:
- Knowage software facilitates interactive dashboards, reports, and advanced analytics.
- It facilitates data/text mining and location intelligence.
- It promotes KPIs, alerting systems and thresholds.
- Affero GPL v3 licensing powers the software.
- The software is available in 6 languages including English, Italian, Chinese, Spanish, French, and Arabic.
- Highly customizable
- OLAP engine for multidimensional analysis
- Easily upload file for new personal data and self-service capabilities
- Comprehensive security for administrators
- Interactive and advanced dashboards with mash-up logic
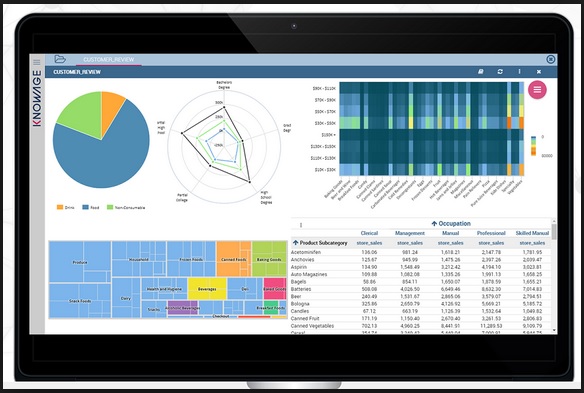
(Source: Knowage)
8. SQL Power Wabit
SQL Power Wabit is an open source BI reporting and analytics software tool. It provides an intuitive BI tool to users around the world. It facilitates WYSIWYG report formatting and no custom coding or Javascripting. The free download is facilitated for SQL Power Wabit v1.3.4 Community Edition. Other notable features of this tool include drag-&-drop playpen, global searching, and live result-set updates.
Highlights:
- The SQL Power Wabit software solution provides custom dashboards and standard reporting.
- Its reporting and analytics features include Line, Bar & Pie Charts, and Drill-down OLAP cubes, and an easy to use drag & drop interface.
- It facilitates Real-time BI Reporting.
- The software also allows the user to auto-create the SQL queries without any manual coding.
- Easily create, modify and customize reports with one-click
- Comes with an “Evolving” result set to refine the reports and queries
- Supports multiple platforms including Mac, Unix, and Windows
- Report scheduling
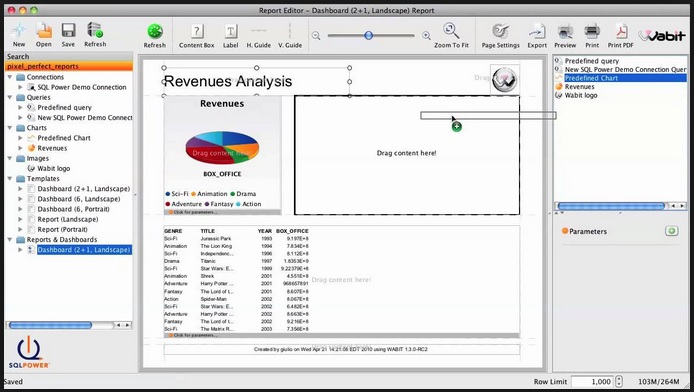
(Source: SQL Power Wabit)
Tableau is one among the best popular reporting software solutions that is preferred by the majority of businesses seeking hi-tech reporting features. Let us discuss more about it in detail.
Tableau
Headquartered in Seattle, Tableau Software is world’s most recognized data visualization software company that is focussed on business intelligence. Tableau software actually lets you change the way you think about data. It makes your reporting procedures easier and convenient on all handy devices. It is among the finest AI-powered analytics platforms to easily transform raw data and information into actionable insights.
(Source: Tableau)
Features:
- The software allows users to easily establish connections to various data sources along with importing and visualizing data quickly and easily.
- Intuitive and easy interface with flexible pricing and deployment.
- The software promotes collaboration and investigates data in many ways.
- Embedded and mobile-ready dashboards, dashboard commenting, metadata management, automatic updates, security permissions server REST API are some of the other features associated with the software.
- Automated and easy-to-understand narratives to dashboards
- Tableau Pulse for personalized metrics
- Scalable data architecture with reusable models
- Integration with native apps, plugins, extensions, connectors, etc.
If you are already using one from the software listed above, you can freely share your reviews here.
Apart from the free and open source reporting software discussed in this blog, there are a few popular, and extremely functional reporting software. Here is a list of the same derived by Goodfirms.
List of most-searched Reporting Software
Used by over 3 million users, Zoho Analytics is an AI-powered data analytics and reporting platform to leverage the power of real time data and insights. Leading businesses like Ikea, eBay, Apollo, etc., rely on this software to connect, collect, prepare, and analyze business data. Features like white-labeled analytics, unified business insights, augmented analytics, data storytelling, embedded BI, and collaborative analytics allow users to upload data into multiple formats, connect with 50+ analytical tools, and develop shareable reports. Zia, an AI-powered data analysis assistant also comes integrated with Zoho Analytics that is useful for smart suggestions, predictive analysis, automated insights, SQL query generation, etc. The free trial is available for 15 days for all the four pricing plans for Zoho Analytics - Basic, Standard, Premium, and Enterprise, after which premium plans start at $24 per month, billed annually.
Among the list of all-in-one reporting software, Fathom is a widely popular tool to gain robust real-time insights and generate relevant reports. SMBs, business advisors, franchises, and various other business groups can implement this tool for in-depth financial data consolidation, group benchmarking, financial planning, report editing, content library, custom templates, report scheduling, financial statement presentation, variance reporting, etc. KPI analysis, profitability analysis, cash flow analysis, growth analysis, trend analysis, divisional analysis, variance analysis, etc., are supported by this software that allows businesses to get a clear idea of business performance. It is available for a 14-day free trial, and premium plans start at $50/month.
Since 1996, InetSoft has been a leading business intelligence software with robust reporting and analytics capabilities in a single tool. More than 5000 businesses trust this reporting solution for real-time monitoring, dashboard visualizations, report publishing and scheduling, ad hoc reporting, data intelligence, self-service analytics, report bursting, etc. Besides these, strong security, publicly shareable dashboards, paginated reports, and agile data mashup features are also available in this software solution. Users can freely download this software or create an online account. Paid pricing for self-hosted and AWS-hosted versions starts at $165 per month, billed annually.
More than 20k+ businesses and marketing agencies rely on Databox to centralize their data, identify room for improvements, and get clear visibility regarding organizational health. It comes with a drag-and-drop builder and 1-click templates to promptly build beautiful and insight-driven dashboards, compare multiple timelines, stream dashboards to TV, create custom presentations, predict future performance, customize reports, and automate performance summaries. Features like custom dashboard creation, report scheduling, data benchmarking, forecasting, goal tracking, proactive performance monitoring, etc., are useful for businesses in making data backed decisions. It is available in both free and paid versions starting from $47/ month, billed annually.
Displayr is a top-notch data visualization and reporting software that is popularly used to achieve better workflow efficiency, self sufficiency, and storytelling capabilities. Sentiment analysis, automated data categorization, word cloud creation, entity extraction, filters, automated statistical tests, latent class analysis, alerts, interactive text, and visualizations, etc., are the best features for market researchers, statisticians, report creators, and other professionals who regularly deal with data. It supports Displayr AI that is best to use for optimizing lengthy and confusing variable names, speeding up text analysis, churning actionable insights, and simplifying text categorization. Besides a 14-day free trial, the premium pricing starts from $40 per month, billed annually.
Since 2017, Reportz has been a white-label reporting software with fully customizable dashboards, real-time data analytics, dashboard sharing, continuous integration, and many more capabilities. Features such as pre-defined templates, dashboard customization, data merge and filters, custom widget builder, continuous monitoring, etc., are beneficial for small to large businesses from almost all industries in tracking data and processes from a centralized place. Reportz also offers several features for digital marketing reporting that marketing teams and agencies can use to create detailed marketing reports, filter only relevant information, upload CSV files, etc. Moreover, integration with leading platforms like Google Analytics, Ahrefs, Semrush, Meta, Google Ads, etc., is also supported to ensure scalability whenever needed. The paid plans start at $23.86 per month, billed annually.
Conclusion:
Big Data and Mobile BI & reporting apps are in huge prevalence these days. Embedded BI along with AI (artificial intelligence) is the real future of the next generation reporting software tools. Users have to just feed in data, get a visual representation of the usable data, gather insights, and make informed decisions. Live data feeds have already taken the place of the traditional reports. Whether it is operational reporting, analytical reporting, or financial reporting, the modern-day reporting tools are capable of handling all necessary requirements and deliver centralized metrics in real-time.
The global reporting software market is estimated to cross $14.94 Billion in 2024 and further expected to rise at a CAGR of 12.81% in the next few years. This data has become a ‘food for thought’ for the experts and analysts to understand how rapidly the trend for digital reports is spreading in the market and benefiting the organizations as well.
The future years are going to experience an extremely customized form of BI-based reporting strategies. The data discovery and data quality management will be at peak and more focus is expected on the combination of clean and secure data for simple and powerful presentation via different kinds of reports. Multi-cloud strategies, artificial intelligence and automation are giving a growing edge to the reporting platforms to develop qualitative reporting software tools that can help in superior business decision-making practices.