Best Reporting Software
Explore and invest in the best reporting software to create customized business intelligence reports.
Your business needs data-driven decision-making competencies, analytics-led discovery and innovation, and reporting-based real-time planning capacities to stay ahead of the competition. However, your business may suffer setbacks without accurate and reliable reporting tools. This is where the best Reporting software can help enterprises identify new opportunities, detect trends, and improve performance with powerful business intelligence reports. Reporting software with inbuilt visualization tools enhances the competencies of managers and business leaders to make informed business decisions.
What is a Reporting Software?
Reporting software is a set of application tools that assist businesses in creating insightful business intelligence(BI) reports, automates reporting functions, and integrates with all channels critical for fetching valuable data. Granular data analyzed with sophisticated reporting software integrated with machine learning can lead to winning analytics for companies. Reporting software tools also possess the functional expertise to complement the analytical talent of the organizations' data scientists, BI executives, and managers. It comes with other features such as tracking KPIs, building customized dashboards, enterprise reporting, data blending, visual analysis, and many more.
How to Select the Best Reporting Tools?
To find the most suitable reporting software, one needs to analyze the types, usability, average pricing, key aspects, and essential features against one's business type and size. Doing all this on your own can be an overwhelming and time-consuming task. This is where Goodfirms can help you to pick the best reporting system software for your business. Goodfirms' software product listing platform is a reliable source for B2B buyers to browse and unearth some of the world's best reporting tools. Compiled by Goodfirms' experienced software research team, the list of top reporting software allows you to choose from the best reporting tools. Check the features, reviews, and pricing, apply filters, compare various software applications on this page, and select the best one that fits your business needs.
List of Reporting Tool | Best Reporting Software
-
![AutyFi]()
Key Benefits Time Saving: Why spend valuable time manually calculating KPIs and tedious reports? AutyFi gives back the time in your day that’s spent on manual reporting and data aggregation by adding ... read more about AutyFi
Entry Level Price$29 Per MonthFree TrialN/APricing TypeFlat Rate50% in Reporting SoftwareFeatures
- Automated Reports
- Customizable Dashboard
- Data Source Connectors
- Drill Down
- Financial Reports
- Marketing Reports
- Report Export
- Sales Reports
- Visual Analysis
Key Details
Industries
-
Capital-markets
-
Computer-software
-
Information-technology-services
-
Restaurants
Licensing & Deployment
-
Proprietary
-
Cloud Hosted
-
Web-based
-
iPhone/iPad
-
Android
-
Windows
-
Mac
-
Linux
Support
- Email
- Phone
-
24x7 Support
Knowledge Base
-
Help Guide
-
Video
-
Blog
Packages
Pricing Type
-
Flat Rate
Preferred Currency
-
USD ($)
Free Version
-
Yes
Payment Frequency
-
Annual Subscription
Available Packages
Standard$29 Per MonthIntegration
Integrated With
- QuickBooks Online
- monday.com
- Shopify
- Salesforce CRM
- HubSpot CRM
-
![Growzilla]()
Growzilla is a leading digital marketing services platform specialising in 100% done-for-you digital marketing systems that help local businesses grow. Our unique selling system, GrowzillaOS, is the most ruthlessly effective system for ... read more about Growzilla
Entry Level PriceContact vendorFree TrialN/APricing TypeFlat Rate5% in Reporting SoftwareFeatures
- Customizable Dashboard
- Sales Reports
Key Details
Industries
-
Architecture-planning
-
Computer-software
-
Construction
-
Information-technology-services
-
Internet
-
Marketing-advertising
-
Mechanical-or-industrial-engineering
-
Retail
Licensing & Deployment
-
Proprietary
-
Cloud Hosted
-
Web-based
-
iPhone/iPad
-
Android
-
Windows
-
Mac
Support
- Email
- Chat
- Phone
-
Weekdays
Training
-
In-person
Knowledge Base
-
Help Guide
-
Video
-
Blog
Packages
Pricing Type
-
Flat Rate
Preferred Currency
-
USD ($)
Free Version
-
No
Payment Frequency
-
Monthly Payment
-
Annual Subscription
-
![ViewMetrics]()
ViewMetrics is an advanced automated reporting tool designed to simplify the creation of marketing reports. By seamlessly connecting to various marketing platforms like Google Analytics, Facebook Ads, and email marketing software, ViewMetrics ... read more about ViewMetrics
Entry Level PriceFree versionFree TrialAvailablePricing TypeFree50% in Reporting SoftwareFeatures
- Automated Reports
- Customizable Dashboard
- Financial Reports
- Marketing Reports
- Report Export
- Sales Reports
- Visual Analysis
Key Details
Industries
-
Marketing-advertising
Licensing & Deployment
-
Proprietary
-
Cloud Hosted
-
Web-based
-
Windows
-
Mac
-
Linux
Support
- Email
-
24x7 Support
Training
-
Documentation
Knowledge Base
-
Help Guide
-
Video
-
Blog
Packages
Pricing Type
-
Free
Preferred Currency
-
USD ($)
Payment Frequency
-
Monthly Payment
-
Annual Subscription
-
![Fathom]()
Fathom is perfect for accountants and advisors who are seeking to deliver more frequent and more engaging advisory and management reporting services. Fathom is also great for business owners who are seeking ... read more about Fathom
Entry Level Price$50 Per MonthFree Trial14 DaysPricing TypeFlat Rate100% in Reporting SoftwareFeatures
- Automated Reports
- Data Source Connectors
- Financial Reports
- Forecasting
- Report Export
- Visual Analysis
Key Details
Industries
-
Accounting
-
Banking
-
Financial-services
Licensing & Deployment
-
Proprietary
-
Cloud Hosted
-
Web-based
Support
- Email
- Phone
-
24x7 Support
Knowledge Base
-
Help Guide
-
Video
-
Blog
Packages
Pricing Type
-
Flat Rate
Preferred Currency
-
USD ($)
Free Version
-
No
Free Trial
-
14 Days Trial
Payment Frequency
-
Monthly Payment
-
Annual Subscription
Available Packages
Standard$50 Per Month -
![Displayr]()
Our two main products are Displayr, the world's first complete survey analysis and reporting tool; and Q, the complete toolkit for market researchers. Our core business is a combination of advanced software ... read more about Displayr
Entry Level Price$40 Per MonthFree TrialAvailablePricing TypePer User100% in Reporting SoftwareFeatures
- Automated Reports
- Customizable Dashboard
- Data Source Connectors
- Financial Reports
- Forecasting
- Marketing Reports
- Report Export
Key Details
Industries
-
Banking
-
Financial-services
Licensing & Deployment
-
Proprietary
-
Cloud Hosted
-
Web-based
Support
- Email
- Phone
-
24x7 Support
Knowledge Base
-
Help Guide
-
Video
-
Blog
Packages
Pricing Type
-
Per User
Preferred Currency
-
USD ($)
Free Version
-
No
Free Trial
-
Available Trial
Payment Frequency
-
Monthly Payment
-
Annual Subscription
Available Packages
Standard$40 Per Month -
![ASTGD]()
ASTGD Pharmacy Management Software is an all-in-one POS solution tailored to optimize pharmacy operations. It helps streamline workflows by automating inventory management, prescription processing, and billing systems. With a user-friendly interface, it ... read more about ASTGD
Entry Level PriceContact vendorFree Trial7 DaysPricing TypePer User4% in Reporting SoftwareFeatures
- Automated Reports
- Customizable Dashboard
- Data Source Connectors
- Drag & Drop
- Financial Reports
- Forecasting
- Marketing Reports
- Report Export
- Sales Reports
Key Details
Industries
-
Accounting
-
Chemicals
-
Computer-software
-
Consumer-goods
-
Consumer-services
-
Pharmaceuticals
Licensing & Deployment
-
Proprietary
-
Cloud Hosted
-
On Premises
-
Web-based
-
Windows
Support
- Chat
-
24x7 Support
Training
-
In-person
Knowledge Base
-
Help Guide
-
Video
-
Blog
Packages
Pricing Type
-
Per User
Preferred Currency
-
USD ($)
Free Version
-
Yes
Free Trial
-
7 Days Trial
Payment Frequency
-
Monthly Payment
-
Annual Subscription
-
One-Time Payment
-
![HR HUB]()
HR HUB redefines HR management with a comprehensive HRMS tailored for modern businesses. Its integrated platform automates payroll, leave management, recruitment, and performance tracking, ensuring efficiency and compliance. Advanced security safeguards sensitive ... read more about HR HUB
Entry Level PriceContact vendorFree TrialN/APricing TypeContact Vendor5% in Reporting SoftwareFeatures
- Automated Reports
- Customizable Dashboard
- Financial Reports
Key Details
Industries
-
Banking
-
Electrical-electronic-manufacturing
-
Government-administration
-
Hospital-health-care
-
Hospitality
-
Human-resources
-
Oil-energy
-
Pharmaceuticals
-
Retail
-
Utilities
Licensing & Deployment
-
Open Source
-
Cloud Hosted
-
Web-based
-
iPhone/iPad
-
Android
-
Windows
-
Mac
Support
- Email
- Chat
- Phone
-
24x7 Support
Knowledge Base
-
Help Guide
Packages
Pricing Type
-
Contact Vendor
Preferred Currency
-
USD ($)
Free Version
-
No
Payment Frequency
-
Monthly Payment
-
Annual Subscription
-
![Niche Report]()
Starting a new business is hard. Starting blind is harder. There are 5 billion humans interacting online everyday. Their noise is overwhelming. Niche report leverages that noise to draw you a map ... read more about Niche Report
Entry Level PriceContact vendorFree TrialN/APricing TypeFlat Rate50% in Reporting SoftwareFeatures
- Automated Reports
- Customizable Dashboard
- Marketing Reports
- Report Export
- Sales Reports
- Visual Analysis
Key Details
Industries
-
Computer-software
Licensing & Deployment
-
Proprietary
-
Cloud Hosted
-
Web-based
-
iPhone/iPad
-
Android
-
Windows
-
Mac
-
Linux
Support
- Email
-
Weekdays
Training
-
Documentation
Knowledge Base
-
Help Guide
Packages
Pricing Type
-
Flat Rate
Preferred Currency
-
USD ($)
Free Version
-
No
Payment Frequency
-
One-Time Payment
-
![Advisory AI]()
Advisory AI is the world's first AI-Copilot for financial advisors and offers cutting-edge AI software, revolutionizing how they create and manage advisory documents. With our intuitive platform, financial professionals can automate any ... read more about Advisory AI
Entry Level PriceContact vendorFree TrialN/APricing TypeContact Vendor80% in Reporting SoftwareFeatures
- Automated Reports
- Financial Reports
- AI Features
Key Details
Industries
-
Financial-services
Licensing & Deployment
-
Open Source
-
On Premises
-
Web-based
-
iPhone/iPad
-
Android
-
Windows
-
Mac
-
Linux
Support
- Email
- Chat
- Phone
-
24x7 Support
Training
-
In-person
-
Documentation
Packages
Pricing Type
-
Contact Vendor
Preferred Currency
-
GBP (£)
Free Version
-
No
Payment Frequency
-
Quote Based
-
![Compassway]()
Comprehensive Digital Lending Platform: Leverage a full suite of lending software solutions for small business that support every phase of the loan lifecycle, from loan origination to servicing and debt collection. Simplify ... read more about Compassway
Entry Level PriceContact vendorFree TrialN/APricing TypeContact Vendor25% in Reporting SoftwareFeatures
- Automated Reports
- Customizable Dashboard
- Marketing Reports
Key Details
Industries
-
Accounting
-
Banking
-
Education-management
-
Financial-services
Licensing & Deployment
-
Proprietary
-
Cloud Hosted
-
Web-based
Support
- Email
- Chat
- Phone
-
24x7 Support
Packages
Pricing Type
-
Contact Vendor
Preferred Currency
-
USD ($)
Free Version
-
Yes
Payment Frequency
-
Quote Based
-
![Dazychain]()
Dazychain legal matter management software empowers in-house legal departments to take control of legal matters, improve collaboration across teams, and establish a centralized location for all your operations, giving you the confidence ... read more about Dazychain
Entry Level PriceContact vendorFree TrialN/APricing TypeContact Vendor10% in Reporting SoftwareFeatures
- Automated Reports
- Customizable Dashboard
- Drag & Drop
Key Details
Industries
-
Legal-services
Licensing & Deployment
-
Proprietary
-
Cloud Hosted
-
Web-based
Support
- Email
-
24x7 Support
Knowledge Base
-
Help Guide
Packages
Pricing Type
-
Contact Vendor
Preferred Currency
-
USD ($)
Free Version
-
No
Payment Frequency
-
Quote Based
-
![RIOT IQ]()
Led by Dr. Russell T. Warne, our research team has developed the best online IQ test & platform. We are setting a new standard in online cognitive ability testing. Measure your own ... read more about RIOT IQ
Entry Level PriceContact vendorFree Trial7 DaysPricing TypeContact Vendor33% in Reporting SoftwareFeatures
- Automated Reports
- Marketing Reports
- Visual Analysis
Key Details
Industries
-
Computer-software
-
Internet
-
Legal-services
Licensing & Deployment
-
Proprietary
-
Cloud Hosted
-
Web-based
-
iPhone/iPad
-
Android
Support
- Email
- Chat
- Phone
-
24x7 Support
Packages
Pricing Type
-
Contact Vendor
Preferred Currency
-
USD ($)
Free Version
-
Yes
Free Trial
-
7 Days Trial
Payment Frequency
-
Monthly Payment
-
Annual Subscription
-
![AI Graph Maker]()
AI Graph Maker is a versatile and user-friendly online tool that allows you to quickly create a variety of professional charts for different purposes, such as data analysis, project management, and presentations—completely ... read more about AI Graph Maker
Entry Level PriceFree versionFree TrialAvailablePricing TypeFree10% in Reporting SoftwareFeatures
- Customizable Dashboard
- Forecasting
- Visual Analysis
- AI Features
Key Details
Industries
-
Consumer-services
-
Information-technology-services
-
Internet
Licensing & Deployment
-
Proprietary
-
Cloud Hosted
-
Windows
Support
- Email
-
Weekdays
Packages
Pricing Type
-
Free
-
![Fynlo]()
Fynlo is an accounting software that makes managing your finances a breeze, with an intuitive design that's perfect for small businesses, freelancers, and startups. Our customers rave about how Fynlo elevates their ... read more about Fynlo
Entry Level Price$0 Per MonthFree Trial30 DaysPricing TypeFlat Rate20% in Reporting SoftwareFeatures
- Automated Reports
- Customizable Dashboard
- Financial Reports
- Report Export
- Sales Reports
- Visual Analysis
Key Details
Industries
-
Accounting
-
Apparel-fashion
-
Architecture-planning
-
Consumer-electronics
-
Consumer-goods
-
Consumer-services
-
Restaurants
-
Writing-editing
Licensing & Deployment
-
Proprietary
-
Cloud Hosted
-
Web-based
-
Windows
-
Mac
Support
- Email
- Phone
-
24x7 Support
Training
-
Webinar
-
Documentation
Knowledge Base
-
Fynlo Help Center
Packages
Pricing Type
-
Flat Rate
Preferred Currency
-
USD ($)
Free Version
-
Yes
Free Trial
-
30 Days Trial
Payment Frequency
-
Monthly Payment
Available Packages
Starter$9 Per MonthProfessional$18 Per MonthIntegration
Integrated With
- PayPal
- Checkout.com
- Stripe Billing
- Xero
- QuickBooks Online
-
![DINGG]()
Dingg.app is a comprehensive cloud-based appointment scheduling and business management platform designed for salons, spas, gyms, skin clinics, and wellness centers. It simplifies operations by offering automated booking, client management, staff scheduling, ... read more about DINGG
Entry Level PriceContact vendorFree TrialN/APricing TypePer User10% in Reporting SoftwareFeatures
- Automated Reports
- Customizable Dashboard
- Financial Reports
- Marketing Reports
- Report Export
- Sales Reports
- Visual Analysis
- AI Features
Key Details
Industries
-
Computer-software
Licensing & Deployment
-
Proprietary
-
Cloud Hosted
-
Web-based
-
iPhone/iPad
-
Android
-
Windows
Support
- Email
- Chat
- Phone
-
24x7 Support
Training
-
Webinar
-
In-person
-
Documentation
Packages
Pricing Type
-
Per User
Preferred Currency
-
INR (₹)
Free Version
-
Yes
Payment Frequency
-
Monthly Payment
-
Annual Subscription
-
![Fluent BI]()
Turn hours of reporting into instant answers Just upload your data (Excel, PDF, CSV, and more) and ask. Fluent BI delivers charts, dashboards, and answers instantly. No code, no delays. Your data ... read more about Fluent BI
Entry Level PriceContact vendorFree TrialN/APricing TypeContact Vendor50% in Reporting SoftwareFeatures
- Automated Reports
- Customizable Dashboard
- Data Source Connectors
- Drag & Drop
- Financial Reports
- Forecasting
- Marketing Reports
- Report Export
- Sales Reports
- Visual Analysis
- AI Features
Key Details
Industries
-
Automotive
-
Banking
-
Capital-markets
-
Financial-services
-
Telecommunications
Licensing & Deployment
-
Proprietary
-
Cloud Hosted
-
Web-based
Support
- Email
-
24x7 Support
Packages
Pricing Type
-
Contact Vendor
Preferred Currency
-
USD ($)
Free Version
-
No
Payment Frequency
-
Monthly Payment
-
Annual Subscription
-
![Petpooja Payroll]()
Petpooja Payroll is a combination of a biometric hardware device and advanced software to simplify attendance, leave, and shift tracking for growing businesses. Built for real-world operations, it helps businesses manage everything ... read more about Petpooja Payroll
Entry Level PriceContact vendorFree TrialN/APricing TypeContact Vendor20% in Reporting SoftwareFeatures
- Automated Reports
- Customizable Dashboard
- Data Source Connectors
Key Details
Industries
-
Accounting
-
Construction
-
Education-management
-
Facilities-services
-
Human-resources
Licensing & Deployment
-
Proprietary
-
Cloud Hosted
-
On Premises
-
iPhone/iPad
-
Android
-
Windows
-
Mac
-
Linux
Support
- Email
- Chat
- Phone
-
24x7 Support
Training
-
Webinar
-
In-person
Packages
Pricing Type
-
Contact Vendor
Preferred Currency
-
INR (₹)
Free Version
-
No
Payment Frequency
-
Annual Subscription
-
One-Time Payment
-
![WaitWell]()
WaitWell is a secure, scalable queue management and appointment scheduling platform that helps organizations improve customer flow, reduce wait times, and operate more efficiently. Customers can book appointments or join virtual queues ... read more about WaitWell
Entry Level Price$29 Per MonthFree TrialN/APricing TypeUsage Based15% in Reporting SoftwareFeatures
- Automated Reports
- Customizable Dashboard
- Drag & Drop
- Financial Reports
- Marketing Reports
- Report Export
- Sales Reports
- Visual Analysis
- AI Features
Key Details
Industries
-
Government-administration
-
Health-wellness-fitness
-
Higher-education
-
Hospital-health-care
-
Hospitality
-
Medical-practice
-
Retail
-
Veterinary
Licensing & Deployment
-
Proprietary
-
Cloud Hosted
-
Web-based
-
iPhone/iPad
-
Android
-
Windows
-
Mac
-
Linux
Support
- Email
- Chat
- Phone
-
24x7 Support
Training
-
Webinar
-
Documentation
Packages
Pricing Type
-
Usage Based
Preferred Currency
-
USD ($)
Free Version
-
No
Payment Frequency
-
Monthly Payment
-
Annual Subscription
-
Quote Based
Available Packages
WaitWell Starter$29 Per MonthWaitWell Basic$55 Per MonthIntegration
Integrated With
- Salesforce CRM
- HubSpot CRM
- CharmHealth
- Oracle PeopleSoft
- Vetspire
- Shepherd
- Azure
- Zoom
- Microsoft Teams
- Google Cloud IoT
- Google Calendar
- Twilio
- Stripe Billing
- Freshservice
- Zendesk Guide
-
![Envoke]()
Envoke is the email marketing platform purpose-built for communications professionals to engage stakeholders and members with opt-in and mandatory emails. Made for communication, not lead generation, Envoke lets you manage multiple subscription ... read more about Envoke
Entry Level PriceContact vendorFree TrialAvailablePricing TypeContact Vendor10% in Reporting SoftwareFeatures
- Automated Reports
- Drag & Drop
- Drill Down
- Marketing Reports
Key Details
Industries
-
Financial-services
-
Hospital-health-care
-
Legal-services
-
Public-policy
Licensing & Deployment
-
Proprietary
-
Cloud Hosted
-
Web-based
Support
- Email
- Phone
-
24x7 Support
Training
-
Documentation
Packages
Pricing Type
-
Contact Vendor
Preferred Currency
-
CAD ($)
Free Version
-
Yes
Payment Frequency
-
Monthly Payment
-
![Whistlelink]()
For over a decade, Whistlelink has provided secure, user-friendly solutions for anonymous and compliant whistleblowing. Trusted across industries like finance, legal, and government, our ISO 27001-certified system meets all EU Directive, GDPR, ... read more about Whistlelink
Entry Level PriceContact vendorFree TrialN/APricing TypeContact Vendor100% in Reporting SoftwareFeatures
- Automated Reports
- Customizable Dashboard
- Data Source Connectors
- Drag & Drop
- Drill Down
- Financial Reports
- Forecasting
- Marketing Reports
- OLAP
- Report Export
- Sales Reports
- Visual Analysis
Key Details
Industries
-
Accounting
-
Business-supplies-equipment
Licensing & Deployment
-
Proprietary
-
Cloud Hosted
-
Web-based
Support
- Email
-
24x7 Support
Packages
Pricing Type
-
Contact Vendor
Preferred Currency
-
USD ($)
Free Version
-
Yes
Payment Frequency
-
Quote Based
-
![Mastt]()
Mastt is AI construction project management software designed for project owners, managers, consultants, and owner’s representatives. The platform centralizes cost management, risk tracking, scheduling, contract control, and reporting, replacing spreadsheets with real-time ... read more about Mastt
Entry Level PriceFree versionFree TrialAvailablePricing TypeFree15% in Reporting SoftwareFeatures
- Automated Reports
- Customizable Dashboard
- Data Source Connectors
- Drag & Drop
- Drill Down
- Financial Reports
- Forecasting
- Marketing Reports
- Report Export
- Sales Reports
- Visual Analysis
- AI Features
Key Details
Industries
-
Airlines-aviation
-
Aviation-aerospace
-
Civil-engineering
-
Commercial-real-estate
-
Construction
-
Defense-space
-
Hospital-health-care
-
Industrial-automation
-
Maritime
-
Mining-metals
-
Oil-energy
-
Railroad-manufacture
-
Real-estate
-
Retail
-
Telecommunications
-
Transportation-trucking-railroad
-
Utilities
Licensing & Deployment
-
Proprietary
-
Cloud Hosted
-
Web-based
Support
- Email
- Chat
- Phone
-
24x7 Support
Training
-
Webinar
-
In-person
-
Documentation
Knowledge Base
-
Mastt Help Page
Packages
Pricing Type
-
Free
Preferred Currency
-
USD ($)
Payment Frequency
-
Monthly Payment
-
Annual Subscription
-
Quote Based
-
![CollabCRM]()
CollabCRM is a comprehensive work management software built to simplify the way IT businesses operate. With dedicated modules for recruitment, human resources, sales, and project management, it replaces scattered tools with a ... read more about CollabCRM
Entry Level PriceContact vendorFree TrialMore than 30 daysPricing TypePer User20% in Reporting SoftwareFeatures
- Financial Reports
- Forecasting
- Marketing Reports
- Report Export
- Sales Reports
Key Details
Industries
-
Information-services
-
Information-technology-services
Licensing & Deployment
-
Proprietary
-
Cloud Hosted
-
iPhone/iPad
-
Android
-
Windows
-
Mac
Support
- Email
- Chat
- Phone
-
24x7 Support
Training
-
Webinar
-
Documentation
Packages
Pricing Type
-
Per User
Preferred Currency
-
USD ($)
Free Version
-
No
Free Trial
-
More than 30 days Trial
Payment Frequency
-
Monthly Payment
-
Annual Subscription
-
Quote Based
-
![Makanify CRM]()
Makanify’s reporting tools generate insights into every aspect of real estate operations — from lead sources to revenue. Users can export or view data through interactive dashboards, enabling precise performance reviews, forecasts, ... read more about Makanify CRM
Entry Level PriceContact vendorFree Trial7 DaysPricing TypePer User4% in Reporting SoftwareFeatures
- Automated Reports
- Customizable Dashboard
- Data Source Connectors
- Drag & Drop
- Drill Down
- Financial Reports
- Forecasting
- Marketing Reports
- OLAP
- Report Export
- Sales Reports
- Visual Analysis
- AI Features
Key Details
Industries
-
Commercial-real-estate
-
Real-estate
Licensing & Deployment
-
Proprietary
-
Cloud Hosted
-
On Premises
-
Web-based
-
iPhone/iPad
-
Android
Support
- Email
- Chat
- Phone
-
24x7 Support
Training
-
Webinar
-
In-person
-
Documentation
Packages
Pricing Type
-
Per User
Preferred Currency
-
INR (₹)
Free Version
-
No
Free Trial
-
7 Days Trial
Payment Frequency
-
Annual Subscription
-
![Work Aware]()
The Reporting module in WorkAware provides organizations with powerful data visualization and analytics tools to monitor safety performance and compliance metrics in real time. It transforms raw operational data—such as incidents, inspections, ... read more about Work Aware
Entry Level PriceContact vendorFree Trial7 DaysPricing TypeUsage Based15% in Reporting SoftwareFeatures
- Customizable Dashboard
- Drag & Drop
- Marketing Reports
- Report Export
- Visual Analysis
- AI Features
Key Details
Industries
-
Construction
Licensing & Deployment
-
Proprietary
-
Cloud Hosted
-
Web-based
-
iPhone/iPad
-
Android
-
Windows
-
Mac
-
Linux
Support
- Email
- Chat
- Phone
-
24x7 Support
Training
-
Webinar
-
Documentation
Packages
Pricing Type
-
Usage Based
Preferred Currency
-
USD ($)
Free Version
-
No
Free Trial
-
7 Days Trial
Payment Frequency
-
Monthly Payment
-
![CAPA Manager Software]()
Adaptive BMS offers powerful and easy-to-use Quality Management Software that helps companies improve quality, meet compliance standards, and solve problems faster. Our leading platform, CAPA Manager, is trusted by businesses in pharmaceutical, ... read more about CAPA Manager Software
Entry Level PriceContact vendorFree Trial14 DaysPricing TypePer User100% in Reporting SoftwareFeatures
- Automated Reports
- Customizable Dashboard
- Data Source Connectors
- Financial Reports
- Report Export
- Visual Analysis
- AI Features
Key Details
Industries
-
Accounting
-
Architecture-planning
-
Automotive
-
Aviation-aerospace
-
Banking
-
Biotechnology
-
Consumer-services
-
Environmental-services
-
Information-technology-services
Licensing & Deployment
-
Proprietary
-
Cloud Hosted
-
Web-based
Support
- Email
- Chat
- Phone
-
24x7 Support
Training
-
Webinar
-
Documentation
Knowledge Base
-
Introduction to CAPA systems
-
Introduce a new Corrective Action system
-
What is the 8D problem solving process
Packages
Pricing Type
-
Per User
Preferred Currency
-
USD ($)
Free Version
-
Yes
Free Trial
-
14 Days Trial
Payment Frequency
-
Monthly Payment
-
![PublisherLens]()
PublisherLens is a free, purpose-built analytics platform for the digital advertising ecosystem. It shows who’s really working with whom—and where the risks are—by ingesting industry-standard data like IAB sellers.json to map relationships ... read more about PublisherLens
Entry Level PriceFree versionFree TrialAvailablePricing TypeFree35% in Reporting SoftwareFeatures
- Marketing Reports
- Sales Reports
Key Details
Industries
-
Marketing-advertising
Licensing & Deployment
-
Open Source
-
Cloud Hosted
-
Web-based
-
iPhone/iPad
-
Android
-
Windows
-
Mac
-
Linux
Support
- Email
-
24x7 Support
Packages
Pricing Type
-
Free
-
![Smart CRM Solution]()
At Smart CRM Solution, we help businesses grow with an easy-to-use, scalable CRM. Our platform integrates lead generation, sales automation, and team management into one dashboard – so you spend less time ... read more about Smart CRM Solution
Entry Level PriceContact vendorFree TrialN/APricing TypeContact Vendor20% in Reporting SoftwareFeatures
- Customizable Dashboard
- Data Source Connectors
- Financial Reports
- Forecasting
- Marketing Reports
- Sales Reports
Key Details
Industries
-
Computer-software
Licensing & Deployment
-
Open Source
-
Cloud Hosted
-
Web-based
-
iPhone/iPad
-
Android
-
Windows
-
Mac
-
Linux
Support
- Email
- Chat
-
24x7 Support
Packages
Pricing Type
-
Contact Vendor
Preferred Currency
-
INR (₹)
Free Version
-
Yes
Payment Frequency
-
Quote Based
-
![Resolve Work]()
Resolve Work CRM is a powerful white-label, all-in-one business management Software designed for digital agencies and service businesses. Resolve Work offers personalized CRM solutions with hands-on support. Our all-in-one CRM platform offers ... read more about Resolve Work
Entry Level PriceContact vendorFree TrialN/APricing TypeContact Vendor17% in Reporting SoftwareFeatures
- Financial Reports
- Marketing Reports
- Report Export
Key Details
Industries
-
Computer-software
Licensing & Deployment
-
Proprietary
-
Cloud Hosted
-
On Premises
-
Web-based
Support
- Email
- Chat
-
24x7 Support
Packages
Pricing Type
-
Contact Vendor
Preferred Currency
-
INR (₹)
Free Version
-
No
Payment Frequency
-
Monthly Payment
-
Annual Subscription
-
Quote Based
-
One-Time Payment
-
![Pet Facility Software]()
Easy Pet Facility Software is an AI-enabled, cloud-based management interface designed for pet grooming salons, boarding kennels, daycare centers, pet hostels, and veterinary clinics. It rationalizes daily operations by unifying online appointment ... read more about Pet Facility Software
Entry Level PriceContact vendorFree TrialN/APricing TypeContact Vendor100% in Reporting SoftwareFeatures
- Automated Reports
- Customizable Dashboard
- Report Export
- Sales Reports
- AI Features
Key Details
Industries
-
Hospital-health-care
-
Veterinary
Licensing & Deployment
-
Open Source
-
Cloud Hosted
-
On Premises
-
Web-based
-
Windows
Support
- Email
- Chat
- Phone
-
24x7 Support
Training
-
Webinar
-
In-person
-
Documentation
Packages
Pricing Type
-
Contact Vendor
Preferred Currency
-
USD ($)
Free Version
-
No
Payment Frequency
-
Annual Subscription
-
![Class ON - School ERP Software]()
Reporting enables schools to generate detailed, real-time reports on attendance, performance, finance, staff, and operations. Customizable dashboards deliver real-time data visualization and actionable insights across academics, finance, and operations, empowering school management ... read more about Class ON - School ERP Software
Entry Level PriceContact vendorFree Trial30 DaysPricing TypePer User1% in Reporting SoftwareFeatures
- Automated Reports
- Customizable Dashboard
- Data Source Connectors
- Drag & Drop
- Drill Down
- Financial Reports
- Report Export
- Visual Analysis
- AI Features
Key Details
Industries
-
Education-management
-
Higher-education
Licensing & Deployment
-
Proprietary
-
Cloud Hosted
-
Web-based
-
iPhone/iPad
-
Android
-
Windows
-
Mac
Support
- Email
- Chat
- Phone
-
24x7 Support
Training
-
Webinar
-
Documentation
Packages
Pricing Type
-
Per User
Preferred Currency
-
INR (₹)
Free Version
-
No
Free Trial
-
30 Days Trial
Payment Frequency
-
Monthly Payment
-
Annual Subscription
-
Quote Based
-
One-Time Payment
-
![TestDino]()
TestDino is an AI-native, Playwright-focused test reporting and analytics platform that turns raw CI output into a clear, searchable system of record. It ingests Playwright JSON reports, centralizes all runs in one ... read more about TestDino
Entry Level Price$0 One-timeFree TrialAvailablePricing TypePer User100% in Reporting SoftwareFeatures
- Automated Reports
- Report Export
- Visual Analysis
- AI Features
Key Details
Industries
-
Computer-software
Licensing & Deployment
-
Proprietary
-
Cloud Hosted
-
iPhone/iPad
-
Android
-
Windows
-
Mac
-
Linux
Support
- Email
- Chat
- Phone
-
24x7 Support
Training
-
In-person
-
Documentation
Knowledge Base
-
Official Docs
-
TestDino Blogs
Packages
Pricing Type
-
Per User
Preferred Currency
-
USD ($)
Free Version
-
Yes
Free Trial
-
Available Trial
Payment Frequency
-
Monthly Payment
-
Annual Subscription
Available Packages
Pro Plan$49 Per MonthTeam Plan$99 Per MonthIntegration
Integrated With
- Jira
- GitHub
- Azure DevOps Server
- Asana
- monday.com
- slack
-
![CockPit]()
CockPit simplifies retail reporting by presenting real time metrics through easy to understand visual dashboards. Instead of relying on static or delayed reports, retail teams can access live sales summaries, payment breakdowns, ... read more about CockPit
Entry Level PriceContact vendorFree Trial7 DaysPricing TypeUsage Based10% in Reporting SoftwareFeatures
- Automated Reports
- Customizable Dashboard
- Drill Down
- Financial Reports
- Report Export
- Sales Reports
- Visual Analysis
Key Details
Industries
-
Apparel-fashion
-
Retail
-
Supermarkets
Licensing & Deployment
-
Proprietary
-
Cloud Hosted
-
Web-based
-
iPhone/iPad
-
Android
Support
- Email
- Chat
- Phone
-
Everyday
Training
-
Webinar
-
In-person
-
Documentation
Packages
Pricing Type
-
Usage Based
Preferred Currency
-
INR (₹)
Free Version
-
Yes
Free Trial
-
7 Days Trial
Payment Frequency
-
Annual Subscription
-
![ListingHub]()
All-in-One AI Marketing Platform for Real Estate Professionals ListingHub.ai is an AI-powered platform designed to help real estate professionals create high-converting marketing content in minutes — without photography, editing, or design skills. ... read more about ListingHub
Entry Level PriceFree versionFree TrialAvailablePricing TypeFree20% in Reporting SoftwareFeatures
- Automated Reports
- Report Export
- Sales Reports
- AI Features
Key Details
Industries
-
Real-estate
Licensing & Deployment
-
Proprietary
-
Cloud Hosted
-
Web-based
Support
- Email
-
24x7 Support
Training
-
Webinar
Packages
Pricing Type
-
Free
Preferred Currency
-
USD ($)
Payment Frequency
-
Monthly Payment
-
![Solidcheck]()
Solidcheck is a digital asset risk and compliance assessment platform offering automated live monitoring and assessments across thousands of token contracts, delivering 24/7 compliance and security. It replaces static, spreadsheet-based reviews with ... read more about Solidcheck
Entry Level PriceContact vendorFree TrialMore than 30 daysPricing TypeUsage Based10% in Reporting SoftwareFeatures
- Automated Reports
- Report Export
- Visual Analysis
- AI Features
Key Details
Industries
-
Banking
-
Financial-services
Licensing & Deployment
-
Proprietary
-
Cloud Hosted
-
Web-based
Support
- Email
- Chat
- Phone
-
24x7 Support
Training
-
Webinar
-
In-person
-
Documentation
Packages
Pricing Type
-
Usage Based
Preferred Currency
-
USD ($)
Free Version
-
No
Free Trial
-
More than 30 days Trial
Payment Frequency
-
Monthly Payment
-
Annual Subscription
-
![MagneFO]()
MagneFo is designed to be an intelligence platform CEOs and other C-suite leaders to aid their clarity and control over their organization’s overall performance. It’s primary reason to exist is to eliminate ... read more about MagneFO
Entry Level PriceContact vendorFree Trial14 DaysPricing TypeUsage Based20% in Reporting SoftwareFeatures
- Customizable Dashboard
- Financial Reports
- Marketing Reports
- Visual Analysis
Key Details
Industries
-
Information-technology-services
Licensing & Deployment
-
Proprietary
-
Cloud Hosted
-
Web-based
-
iPhone/iPad
-
Android
-
Windows
Support
- Email
- Phone
-
24x7 Support
Training
-
Documentation
Packages
Pricing Type
-
Usage Based
Preferred Currency
-
USD ($)
Free Version
-
No
Free Trial
-
14 Days Trial(Credit card required)
Payment Frequency
-
Monthly Payment
-
Annual Subscription
-
Quote Based


Why Trust Goodfirms
Goodfirms is the world’s leading reviews and ratings company featuring 110,000+ tech companies from across the globe, complete with 80,000+ humanly vetted client reviews, detailed portfolios, hourly rates, employee strength, and more to help you choose your perfect tech partner.
Humanly-Vetted Client Reviews
Our researchers have personally vouched for the authenticity of 80,000+ client reviews by speaking directly with clients, cross-checking project details, timelines, and results to ensure 100% credibility.
Data-Driven Rankings
Data powers our company listings. Every company listed is evaluated based on its expertise, experience, market presence, reviews, and client satisfaction rate, which helps buyers confidently choose the right tech partner.
Global Trust & Recognition
Goodfirms is trusted by 110,000+ businesses in 160+ countries to connect with reliable tech partners. Our reputation is built on 80,000+ verified reviews and rankings you can trust.
Transparency In Detail
From verified client reviews and portfolio highlights to service focus and pricing, Goodfirms provides a 360-degree view of every company, helping 2+ million monthly users find the perfect tech partner.
Trending insights from Goodfirms
Valuable insights from top experts accelerate decision-making.
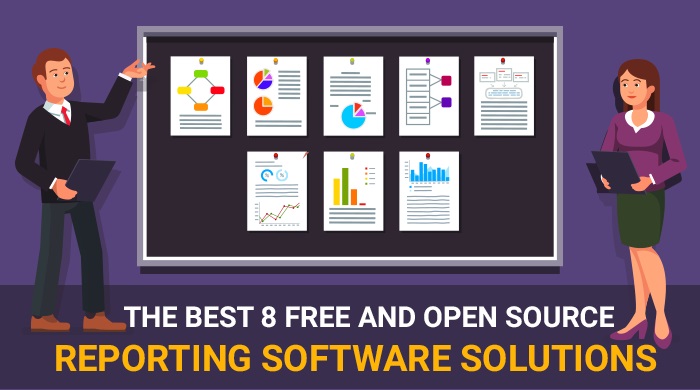
The Best 8 Free and Open Source Reporting Software Solutions
Business Intelligence is highly supported by the advanced open source reporting software systems and hence, enabled the entire processing of business easier,... ... Read research article
IT Management Software Comparison 2026: 12 Platforms Enterprise Teams Actually Use
Which IT management software is best in 2026? Compare 12 platforms by TCO, AI capabilities, and real enterprise use cases. Find the right ITSM, ITOM, or... ... Read research article
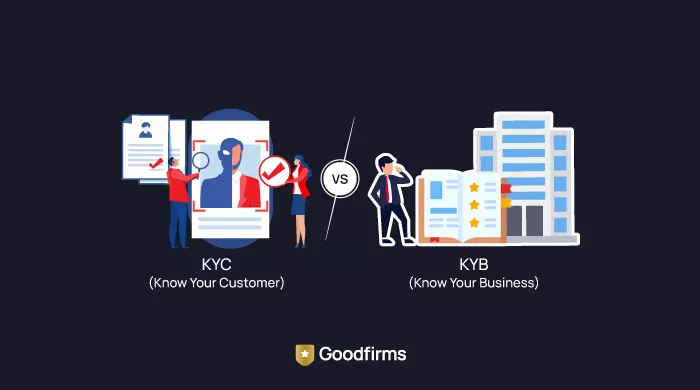
Top KYC & KYB Software Providers for Neobanks in 2026
Discover the top KYC & KYB software providers for neobanks in 2026. Compare features, pricing, and AI-driven identity verification tools to ensure secure... ... Read research article