


Industry Leaders

Top-right · Both axes ≥ 50
113FIRMS
Strong on both Core Competencies and 360-Performance. These firms have proven track records, deep specialisation, and solid client outcomes. Default recommendation for most buyers.
Goodfirms has reviewed 9,504 iPad App Development Companies as of September 2026 across 119 countries. The top-ranked firm is Utility (5.0 stars, 18 verified reviews, $150 - $199/hr, founded 2013, NYC). Across the category, the median hourly rate is $37, median client rating is 4.8, and 28% of firms employ 50+ members. Explore the vetted iPad App Development Companies below, compare their strengths, and connect with the provider best suited to your requirements.
iPad app development helps businesses create powerful, high-performance applications that leverage the larger screen, advanced capabilities, and premium user experience of Apple's iPad ecosystem. Whether you're building an enterprise productivity app, healthcare solution, education platform, eCommerce application, creative tool, or a custom business application, choosing the right iPad app development company is essential for delivering a secure, scalable, and intuitive user experience. Modern iPad applications often integrate Apple Pencil support, multitasking, cloud synchronization, AI-powered features, enterprise integrations, and seamless compatibility across the Apple ecosystem to maximize productivity and user engagement.
Goodfirms helps businesses discover, compare, and hire trusted iPad app development companies through a transparent, research-driven evaluation methodology. Every iPad app development company is assessed using verified client reviews, portfolio quality, technical expertise, industry experience, service specialization, market presence, and Goodfirms' multi-step verification process to help businesses identify reliable development partners.
Use this directory to compare top iPad app development companies by verified reviews, hourly rates, location, team size, technology expertise, and budget. Explore detailed company profiles, portfolios, and client feedback to confidently shortlist the right iPad app development company for your next iPadOS application or enterprise mobility project.
Goodfirms has verified 9,507 iPad App Development Companies - part of 26,593+ Mobile App Development Companies reviewed across 119 countries, each passing Goodfirms' 4-step verification process (background check, client interviews, portfolio audit, ongoing quality review). Listings marked "Sponsored" are agencies that pay for premium placement - sponsorship does not affect star ratings or review content.
Compare the highest-ranked firms first side by side.

BRB TECH is an innovative technology company and a proud subsidiary of the Business Development Bank (BRB). We specialize in developing digital solutions that empower organizations to streamline their operations, improve efficiency, and accelerate growth. Our core mission is to bridge the gap between business and technology by delivering secure, scalable, and user-friendly digital ecosystems. ... read BRB-TECH reviews & insights

At JanBask IT Consulting, we help businesses use technology to grow smarter and work more efficiently. Our goal is to make digital transformation practical, measurable, and aligned with your business goals. We partner with startups, mid-sized companies, and enterprises to design and implement solutions that simplify operations, improve customer engagement, and support long-term success. Our ... read JanBask IT Consulting reviews & insights

Since 2009, we’ve helped top U.S. digital agencies scale their web development teams with top talent from Latin America. Here’s why we’re the go-to partner for staff augmentation: Same Time Zone: Our teams work during your business hours for seamless communication and collaboration. Cost-Effective Solutions: ... read weKnow Inc. reviews & insights
Great Outcome! - AnonymousGoodfirms recommends the top 3. You pick the winner.
Goodfirms is the world’s leading reviews and ratings company featuring 100,000+ tech companies from across the globe, complete with 80,000+ humanly vetted client reviews, detailed portfolios, hourly rates, employee strength, and more to help you choose your perfect tech partner.
Our researchers have personally vouched for the authenticity of 80,000+ client reviews by speaking directly with clients, cross-checking project details, timelines, and results to ensure 100% credibility.
Data powers our company listings. Every company listed is evaluated based on its expertise, experience, market presence, reviews, and client satisfaction rate, which helps buyers confidently choose the right tech partner.
Goodfirms is trusted by 100,000+ businesses in 160+ countries to connect with reliable tech partners. Our reputation is built on 80,000+ verified reviews and rankings you can trust.
From verified client reviews and portfolio highlights to service focus and pricing, Goodfirms provides a 360-degree view of every company, helping 2+ million monthly users find the perfect tech partner.
Valuable insights from top experts accelerate decision-making.
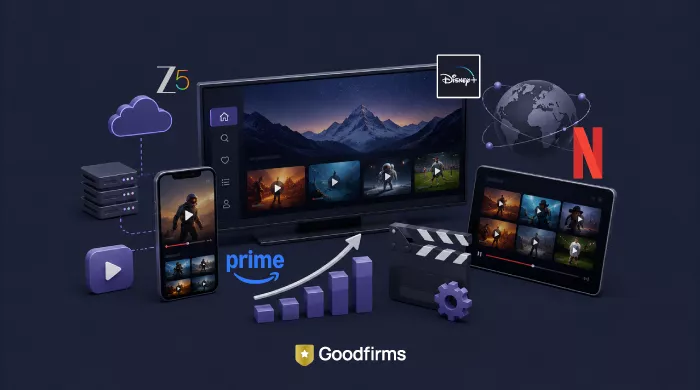
OTT app development in 2026: real costs, tech stack picks, must-have features, and the 5 mistakes that derail even well-funded launches.

Explore legacy application modernization strategies, 7 Rs, costs, process, AI, challenges, and best practices for modernizing enterprise applications in 2026.
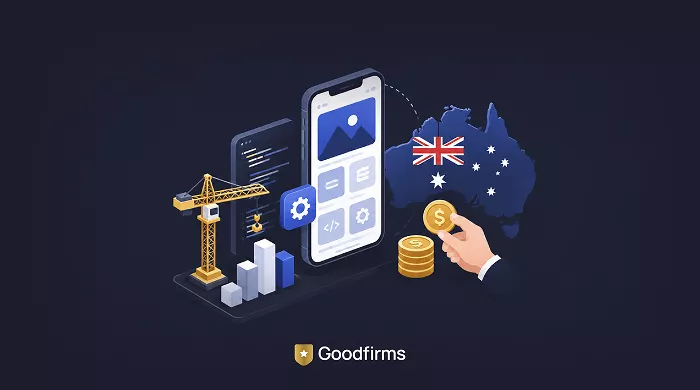
Mobile app development in Australia can cost AUD 30,000–300,000+. See the 2026 cost breakdown by app type, platform, developer rates, and more.
Hover any bubble for the firm's exact scores. Filter the view using the controls on the right.
Each card shows the count of firms in that quadrant and the top 5 by composite score.
Strong on both Core Competencies and 360-Performance. These firms have proven track records, deep specialisation, and solid client outcomes. Default recommendation for most buyers.
Strong execution but broader service mix. High-quality generalists - good fit if your project crosses multiple disciplines in one engagement.
Deeply specialised but with moderate market presence. Often the right pick when specialisation matters more than scale - boutique shops with deep technical chops.
Newer entrants and smaller boutiques. Higher risk but often the best price-performance - particularly for early-stage startups or non-mission-critical projects.
The 8 highest-scoring firms in the Industry Leaders quadrant. Each has both Core Competencies and 360-Performance ≥ 50. Click any card for the full profile.
Every position on this chart is the output of the Goodfirms ranking algorithm - a weighted composite of signals across two axes. The algorithm is recomputed regularly and is fully documented.
Sponsorship does not affect placement. PRO members receive visible badges and ad placements, but their algorithmic scores are calculated identically to free listings.
Read the full methodology


 India · $0-24/hr
 United States · $50-99/hr