iPhone and Android power a spectacular 71% of smartphones today, and this percentage will only increase in the coming years.
Look around, almost everyone is glued to their phones, calling, messaging, shopping online, gaming, entertaining, streaming, and so much more.
With smartphones commanding so much user attention, it‘s no surprise that two titans of the mobile world, iPhone developers and Android developers, seem to be constantly at each other's throats to claim their pound of flesh.
But then, come to think of it, is all this buzz around iPhone vs. Android a fact or just a figment of our imaginations?
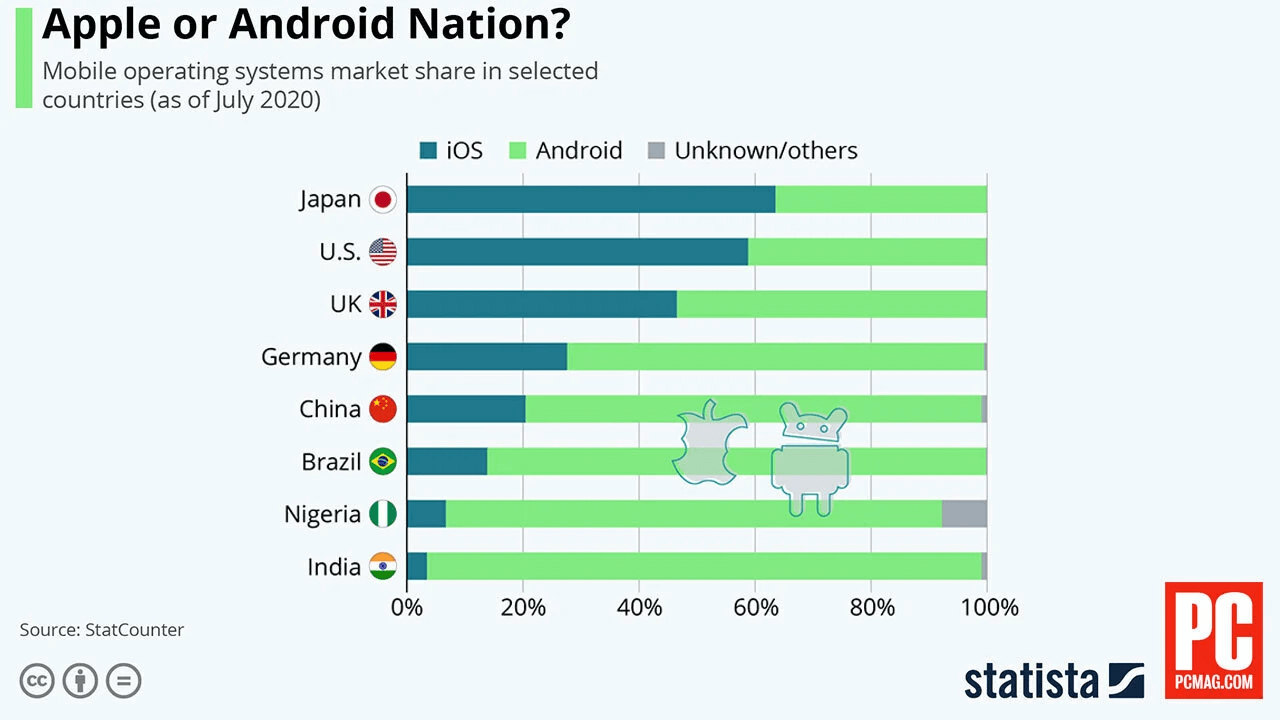
Sure, Android has pulled the carpet from the iPhone's feet in terms of downloads and reach by cementing its position in cost-sensitive destinations such as India, Brazil, Indonesia, South Africa, and Eastern Europe. In contrast, iPhone enjoys a significant market share in wealthier markets like the U.S., Japan, Canada, and Australia.
Android's USP is its affordability, which is resulting in massive downloads and global reach. iPhone, on the other hand, thrives on higher app store revenue and higher retention among the affluent class. This clear market demarcation means the rivalry may exist on paper rather than in practice.
The following 20+ Android vs. iPhone stats and facts back this up, revealing how these two platforms operate and dominate in different territories, each excelling in different metrics.
Before diving into the stats, here’s a visual summary from Goodfirms' infographic on app development cost and time to develop lookalike versions of some of the most popular apps.
Without further ado, let’s start with the stats and facts:
Key Takeaways:
- In 2025, Android commands 72.13% of the market share, a massive jump of 2.41% from 2009.
- iOS started at 34% in 2009, dipping in the middle years, then stabilized around 27-30% recently.
- Asia, Africa, Latin America, and Western Europe are Android Nations with a staggering 95% Market Share in India
- iPhone Leads the U.S. Smartphone Market with 58.62% Share and over 50% in developed nations like Japan. Canada, Australia, and the United Kingdom.
- Google Play Store leads in both app numbers (2.44 million) and app categories (46) and boasts three times more downloads, the Apple App Store mints more and generated $103.4 billion in revenue through IAPs, while Google Play generated $46.7 billion.
- Millennials and Gen Z prefer iPhones, while the non-tech-savvy, older generation favors Android.
- Android has an 81% push notification open rate.
- Both platforms enjoy higher customer retention rates - Android (89 to 91%) and iPhone (85 to 88%).
- iPhone users have higher incomes, a fact reflected in the higher starting price of iPhones ($799) versus Android phones ($286)
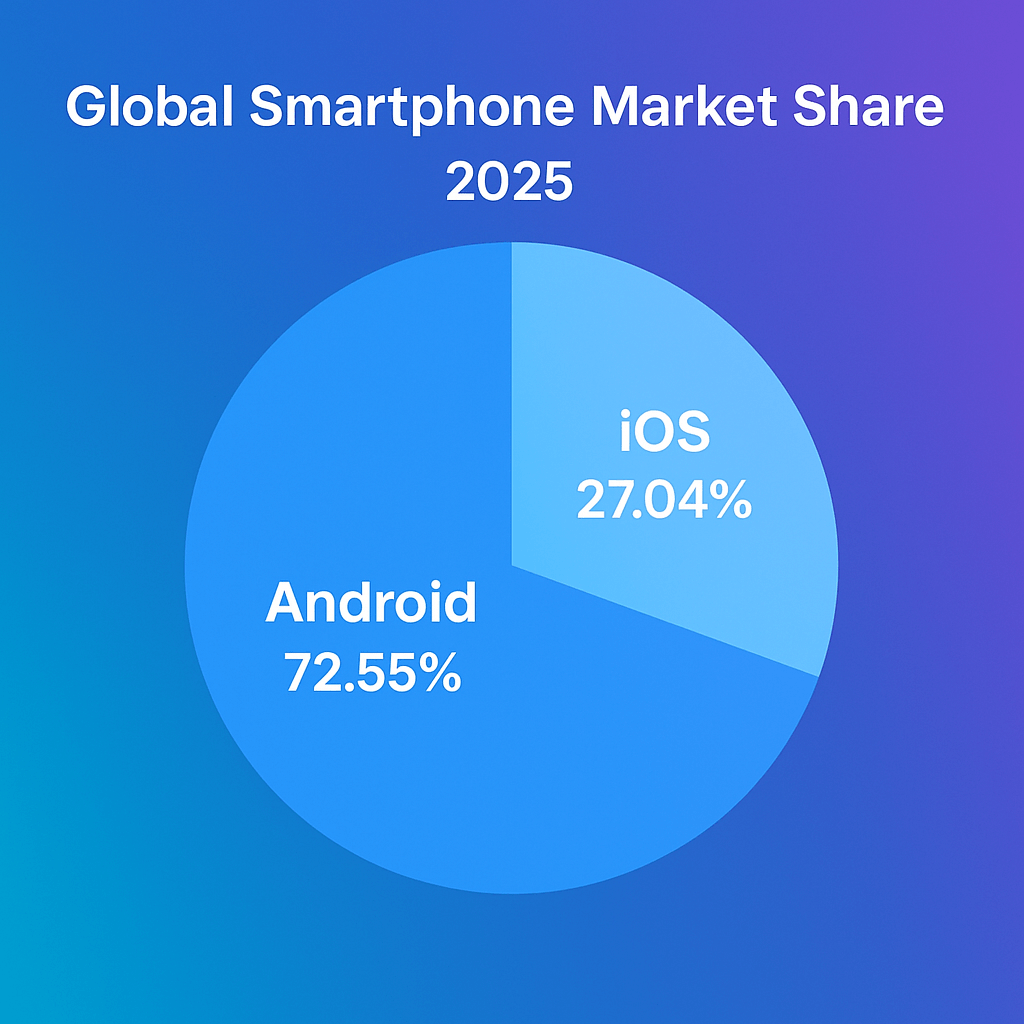
#1. In 2025, Android Reigns the Global Smartphone Market with 72.55% share
According to the latest statistics by Statcounter, in 2025, Android dominates the global smartphone market with a significant 72.55% share, while iOS (iPhone) has a 27.04% share.
As of May 2025, Android leads the global mobile OS market.
Table 1 shows the global market share of different operating systems.
| Platform Market Share | % of Global OS share |
| Android | 72.13% |
| iOS | 27.48% |
| Samsung | 0.21% |
| Others/Unknown | 0.12% |
| KaiOS | 0.02% |
| Linux | 0.01% |
#2. From Underdog to Titan: Android Surges from 2.41% in 2009 to 72.13% in 2025, Overtaking iOS Over the Years
Android's incredible growth from 2.41% in 2009 to 72.13% in 2025, surpassing iOS, is mainly driven by its open-source nature, cost-effectiveness, and diverse device range, especially in cost-sensitive markets such as Africa, India, Western Europe, and Latin America. This has enabled its wider reach in different economic segments and served a broader user base globally. Historical stats from the Goodfirms Android vs iOS historical report reveal how Android quickly overtook iOS in just five years.
The bar graph compares Android and iOS mobile OS market share from 2009 to 2025

Table 2 highlights the global market share of different operating systems from 2009 to 2025.
| Year | iOS | Android |
| 2009 | 34.01% | 2.41% |
| 2010 | 25.48% | 8.82% |
| 2011 | 22.29% | 19% |
| 2012 | 24.04% | 27.41% |
| 2013 | 24.03% | 39.21% |
| 2014 | 23.95% | 53.65% |
| 2015 | 20.20% | 64.20% |
| 2016 | 19.29% | 69.11% |
| 2017 | 19.65% | 72.63% |
| 2018 | 20.47% | 75.45% |
| 2019 | 22.71% | 75.47% |
| 2020 | 26.28% | 73.06% |
| 2021 | 27.34% | 71.89% |
| 2022 | 27.85% | 71.47% |
| 2023 | 29.02% | 70.26% |
| 2024 | 28.32% | 70.93% |
| 2025 | 27.48% | 72.13% |
Source: StatCounter
#3. Asia, Africa, Latin America, and Western Europe are Android Nations
- Asia: Android dominates 80–95% of the Asian market with India leading from the front with 95.16% due to cost-efficient brands like Xiaomi and Oppo.
- Africa: African regions are no less with Android sweeping 85% of the market share; iOS is at 13%.
- Latin America: Android, driven by affordable devices, enjoys an 81.45% share in Brazil.
- Western Europe: Android has captured 68% of the market share.
#4. iPhone Leads the U.S. Smartphone Market with 58.62% Share
In 2025, the iPhone will be leading the U.S. smartphone market, with a share of 58.62% while Android phones' share is 40.86%
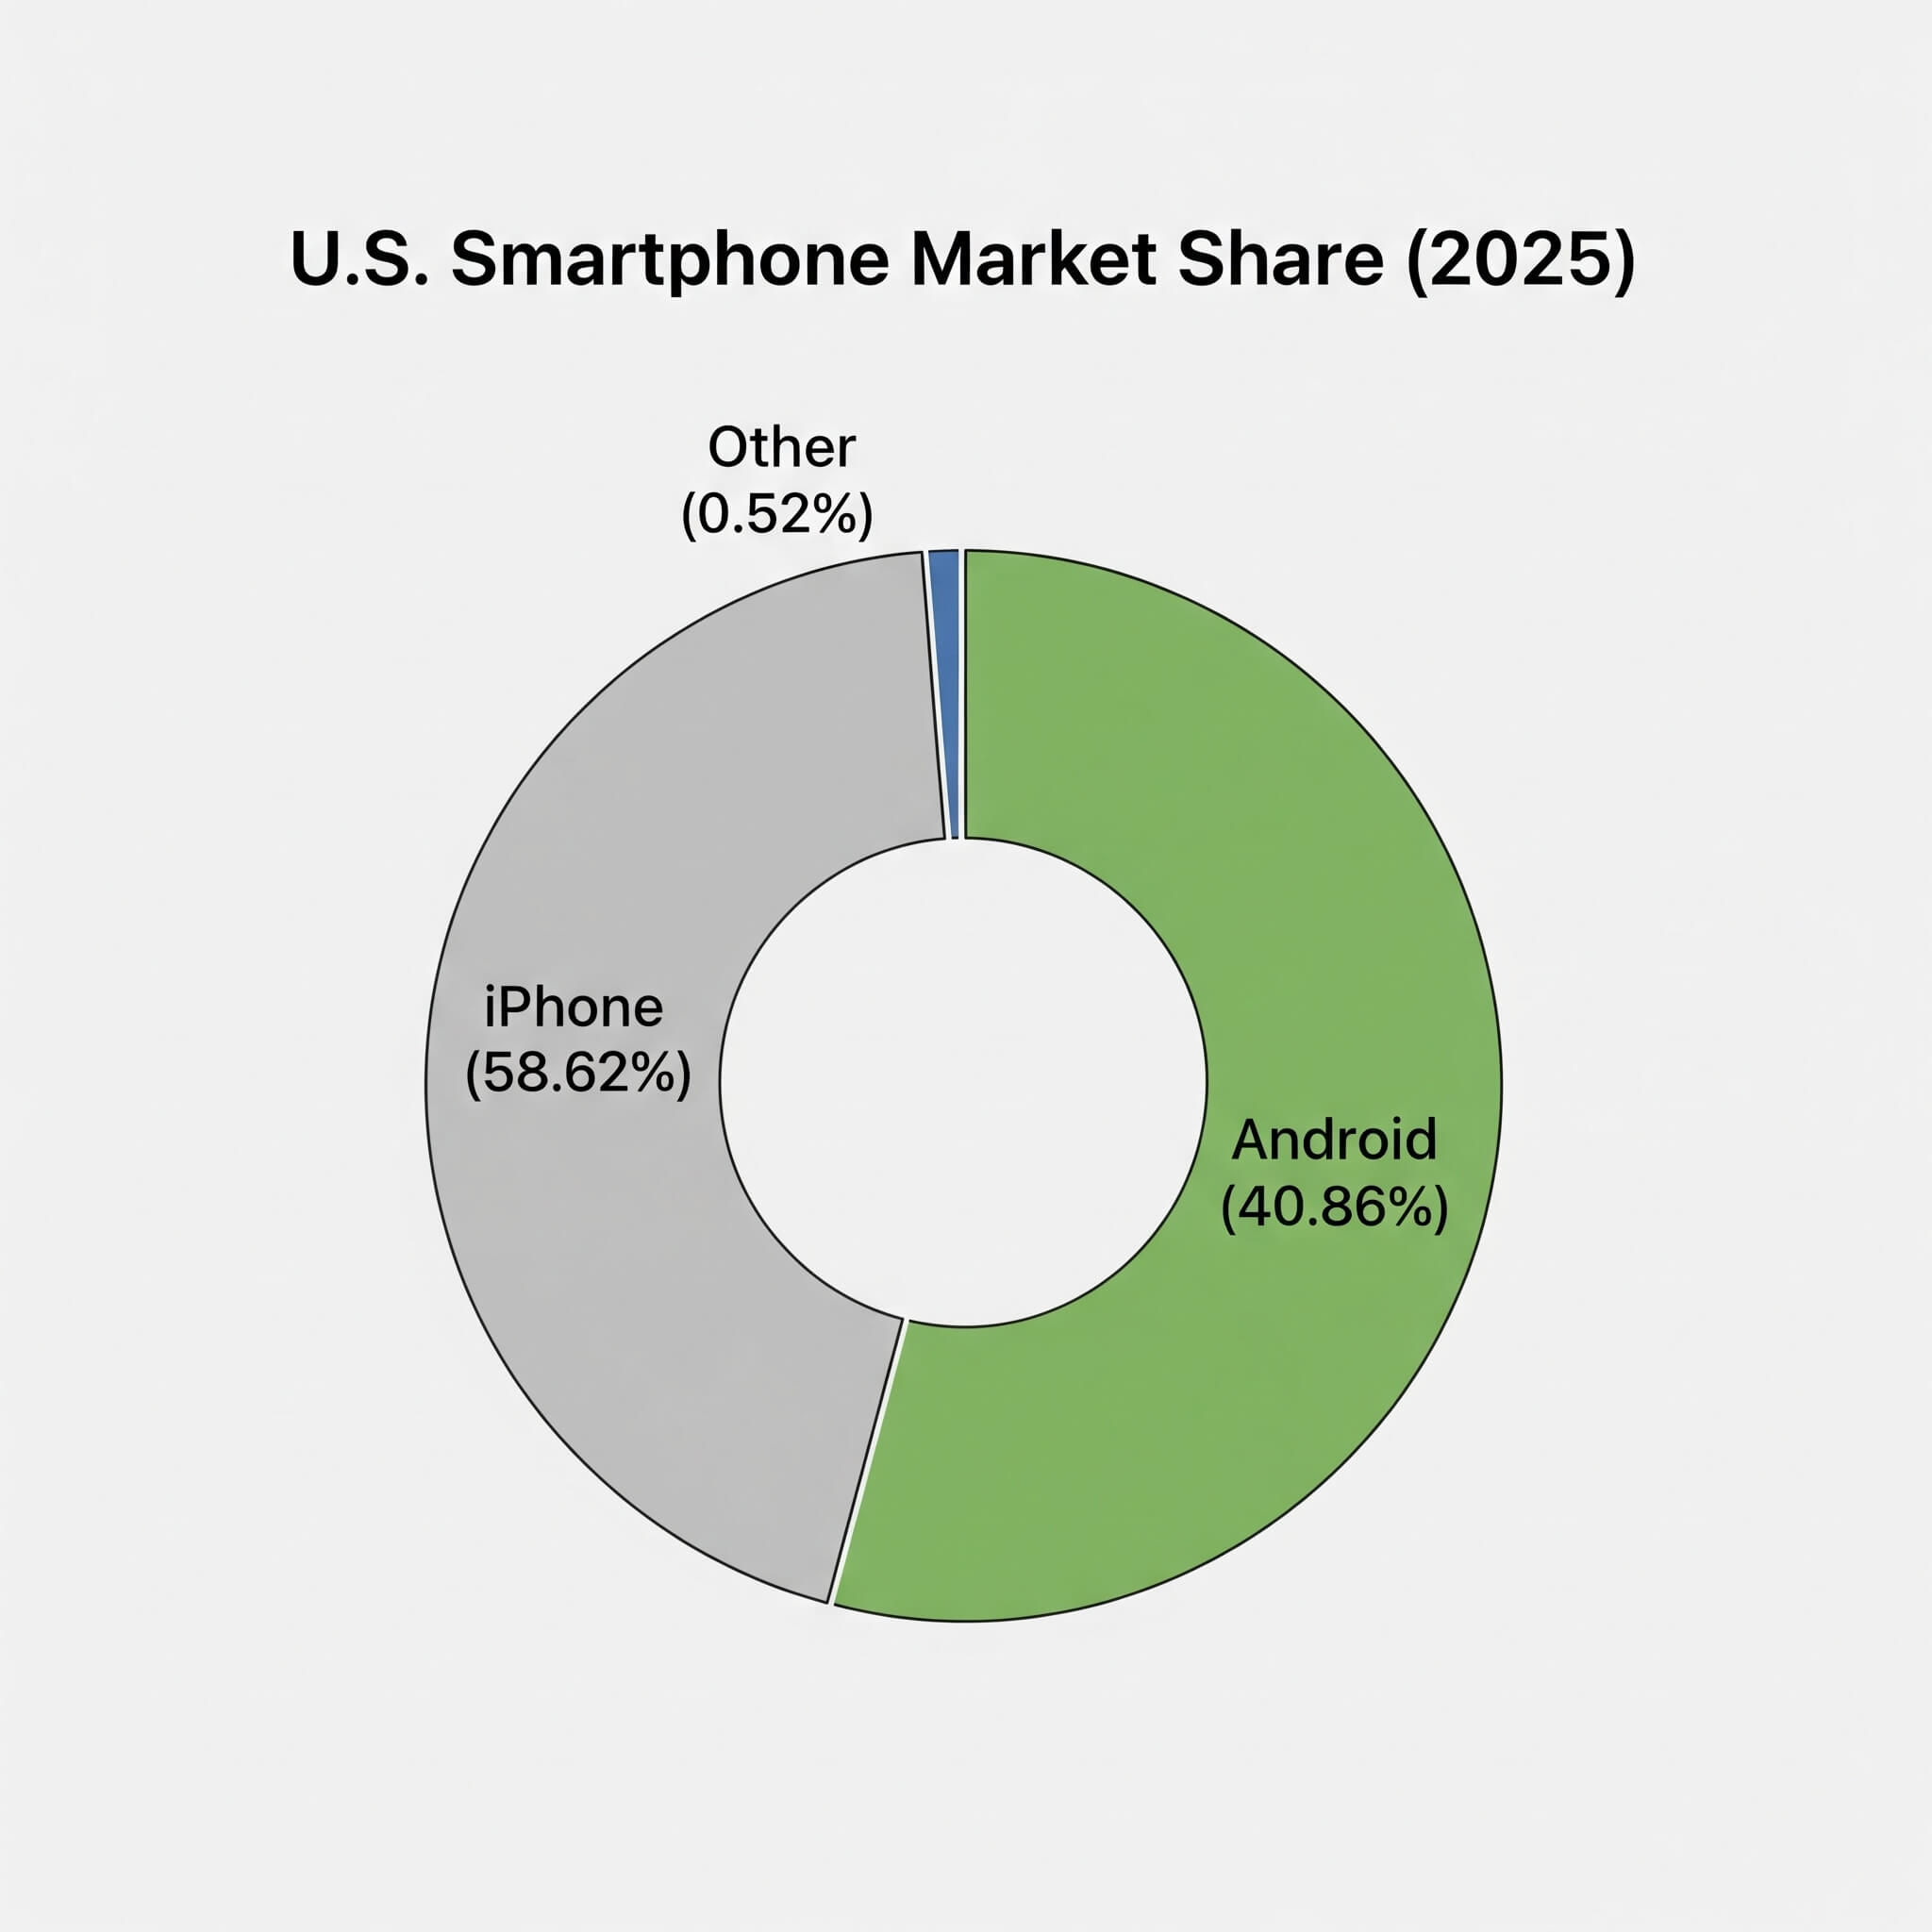
Table 3 highlights the market share of different operating systems in the U.S.
| Platform Market Share | % of U.S. OS Share |
| iOS | 58.62% |
| Android | 40.86% |
| Samsung | 0.21% |
| Windows | 0.02% |
| KaiOS | 0.01% |
| Linux | 0.01% |
Besides the US, iPhone has a remarkable market share in Japan (70%), Canada (60.04%), Australia (59.63%), and the United Kingdom (52.29%).
Table 4 highlights the market share of Android and iPhones in the U.S.
| Year | iOS Market Share | Android Market Share |
| 2025 | 58.64% | 41.1% |
| 2024 | 57.09% | 42.62% |
| 2023 | 58.1% | 41.46% |
| 2022 | 56.74% | 42.94% |
| 2021 | 58.58% | 41.11% |
| 2020 | 59.54% | 40.2% |
| 2019 | 55.23% | 44.51% |
| 2018 | 54.82% | 44.73% |
Source: StatCounter
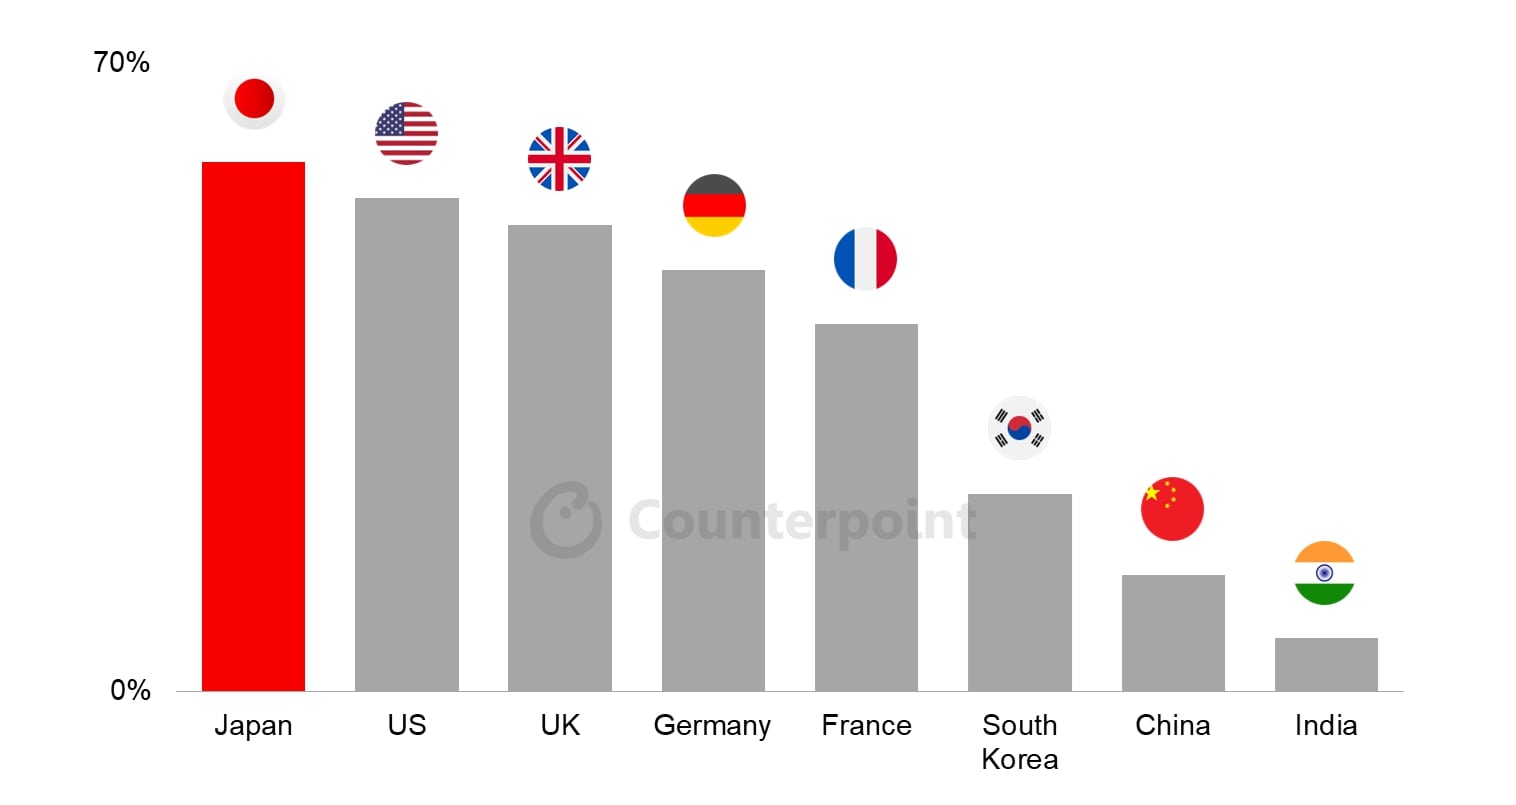
#5. In Japan, iPhone Continues to Dominate with the Release of the iPhone 16e Early this Year
Japan’s smartphone sales have been largely driven by Apple’s robust performance. In Q1 2025, Apple saw a 57% increase in sales, driven by strong sales of the iPhone 16e, launched in February 2025, the company’s first mid-range device in the last three years, combined with the continual success of the iPhone 16 series, launched in 2024.
As you can see in the chart below, Apple’s market share is significantly higher compared to other major countries, specifically in Asia. Apple’s dominance in Japan is said to be due to various historical developments in the telecommunications sector and other cultural factors.
#6. In Canada, iPhone Enjoys 60.04% Market Share
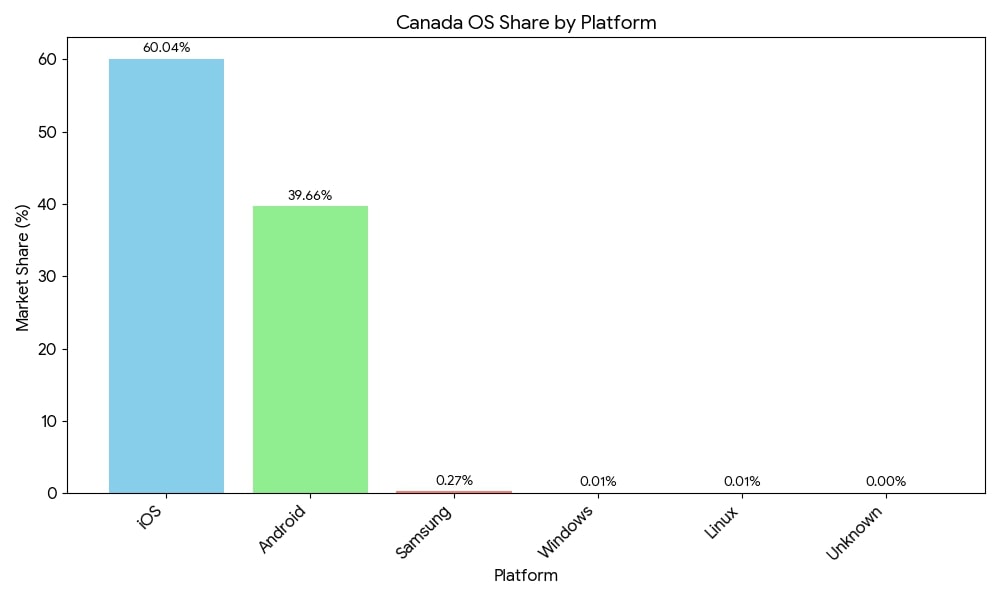
Table 5 highlights the market share of different operating systems in Canada.
| Platform Market Share | % of Canada OS Share by Platform |
| iOS | 60.04% |
| Android | 39.66% |
| Samsung | 0.27% |
| Windows | 0.01% |
| Linux | 0.01% |
| Unknown | 0% |
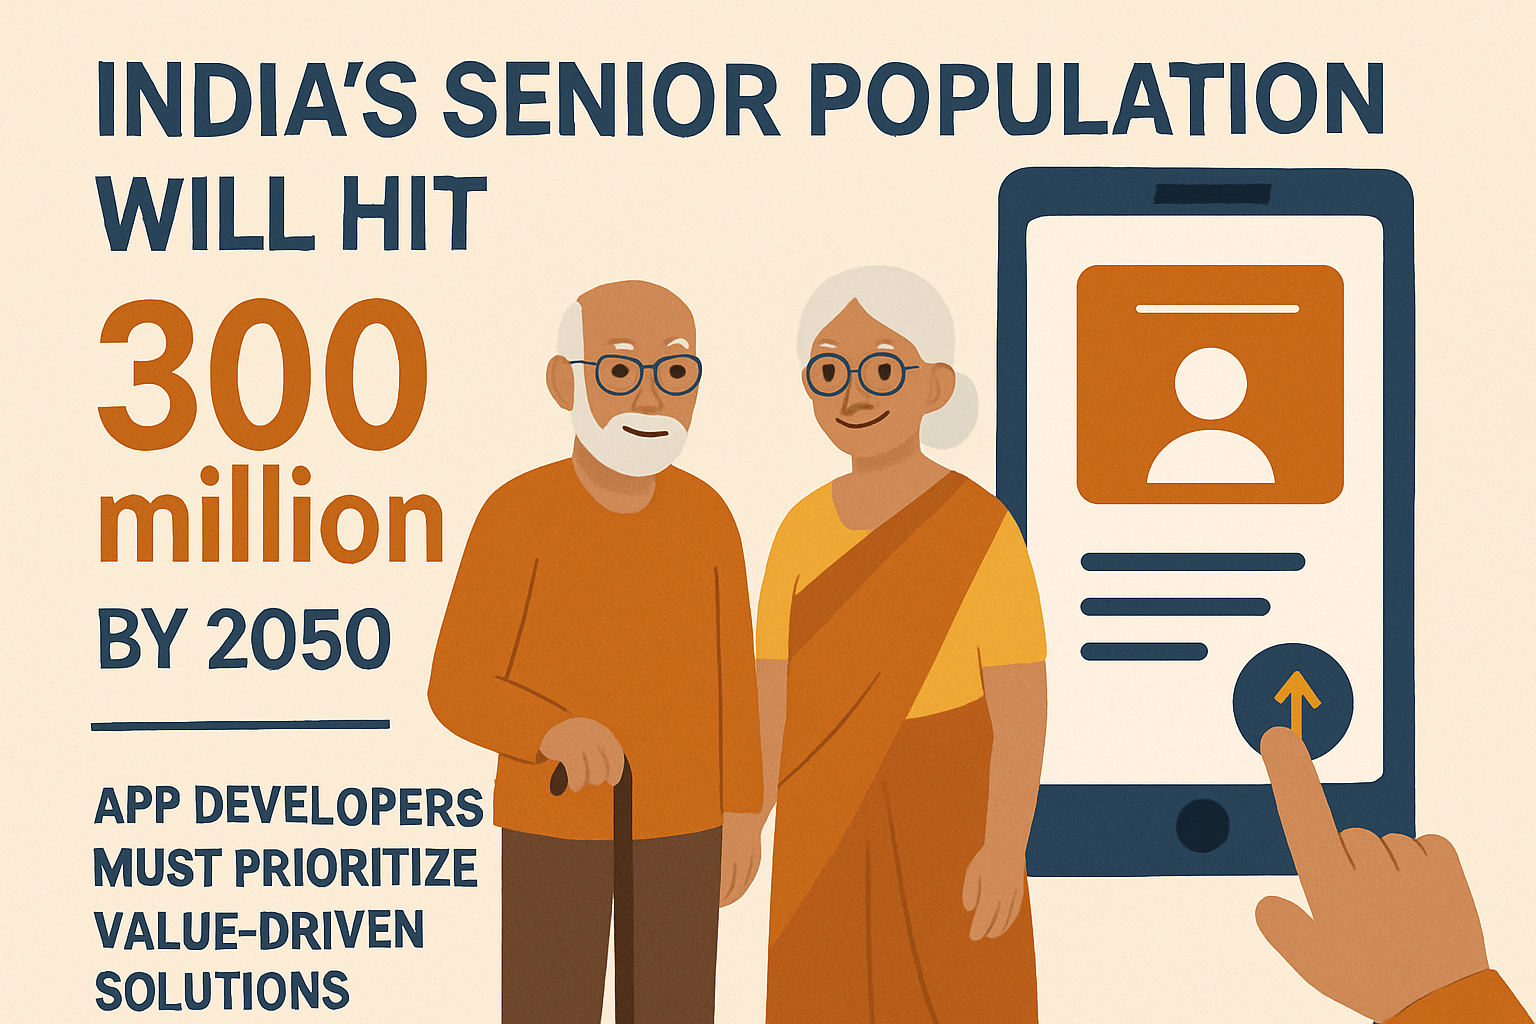
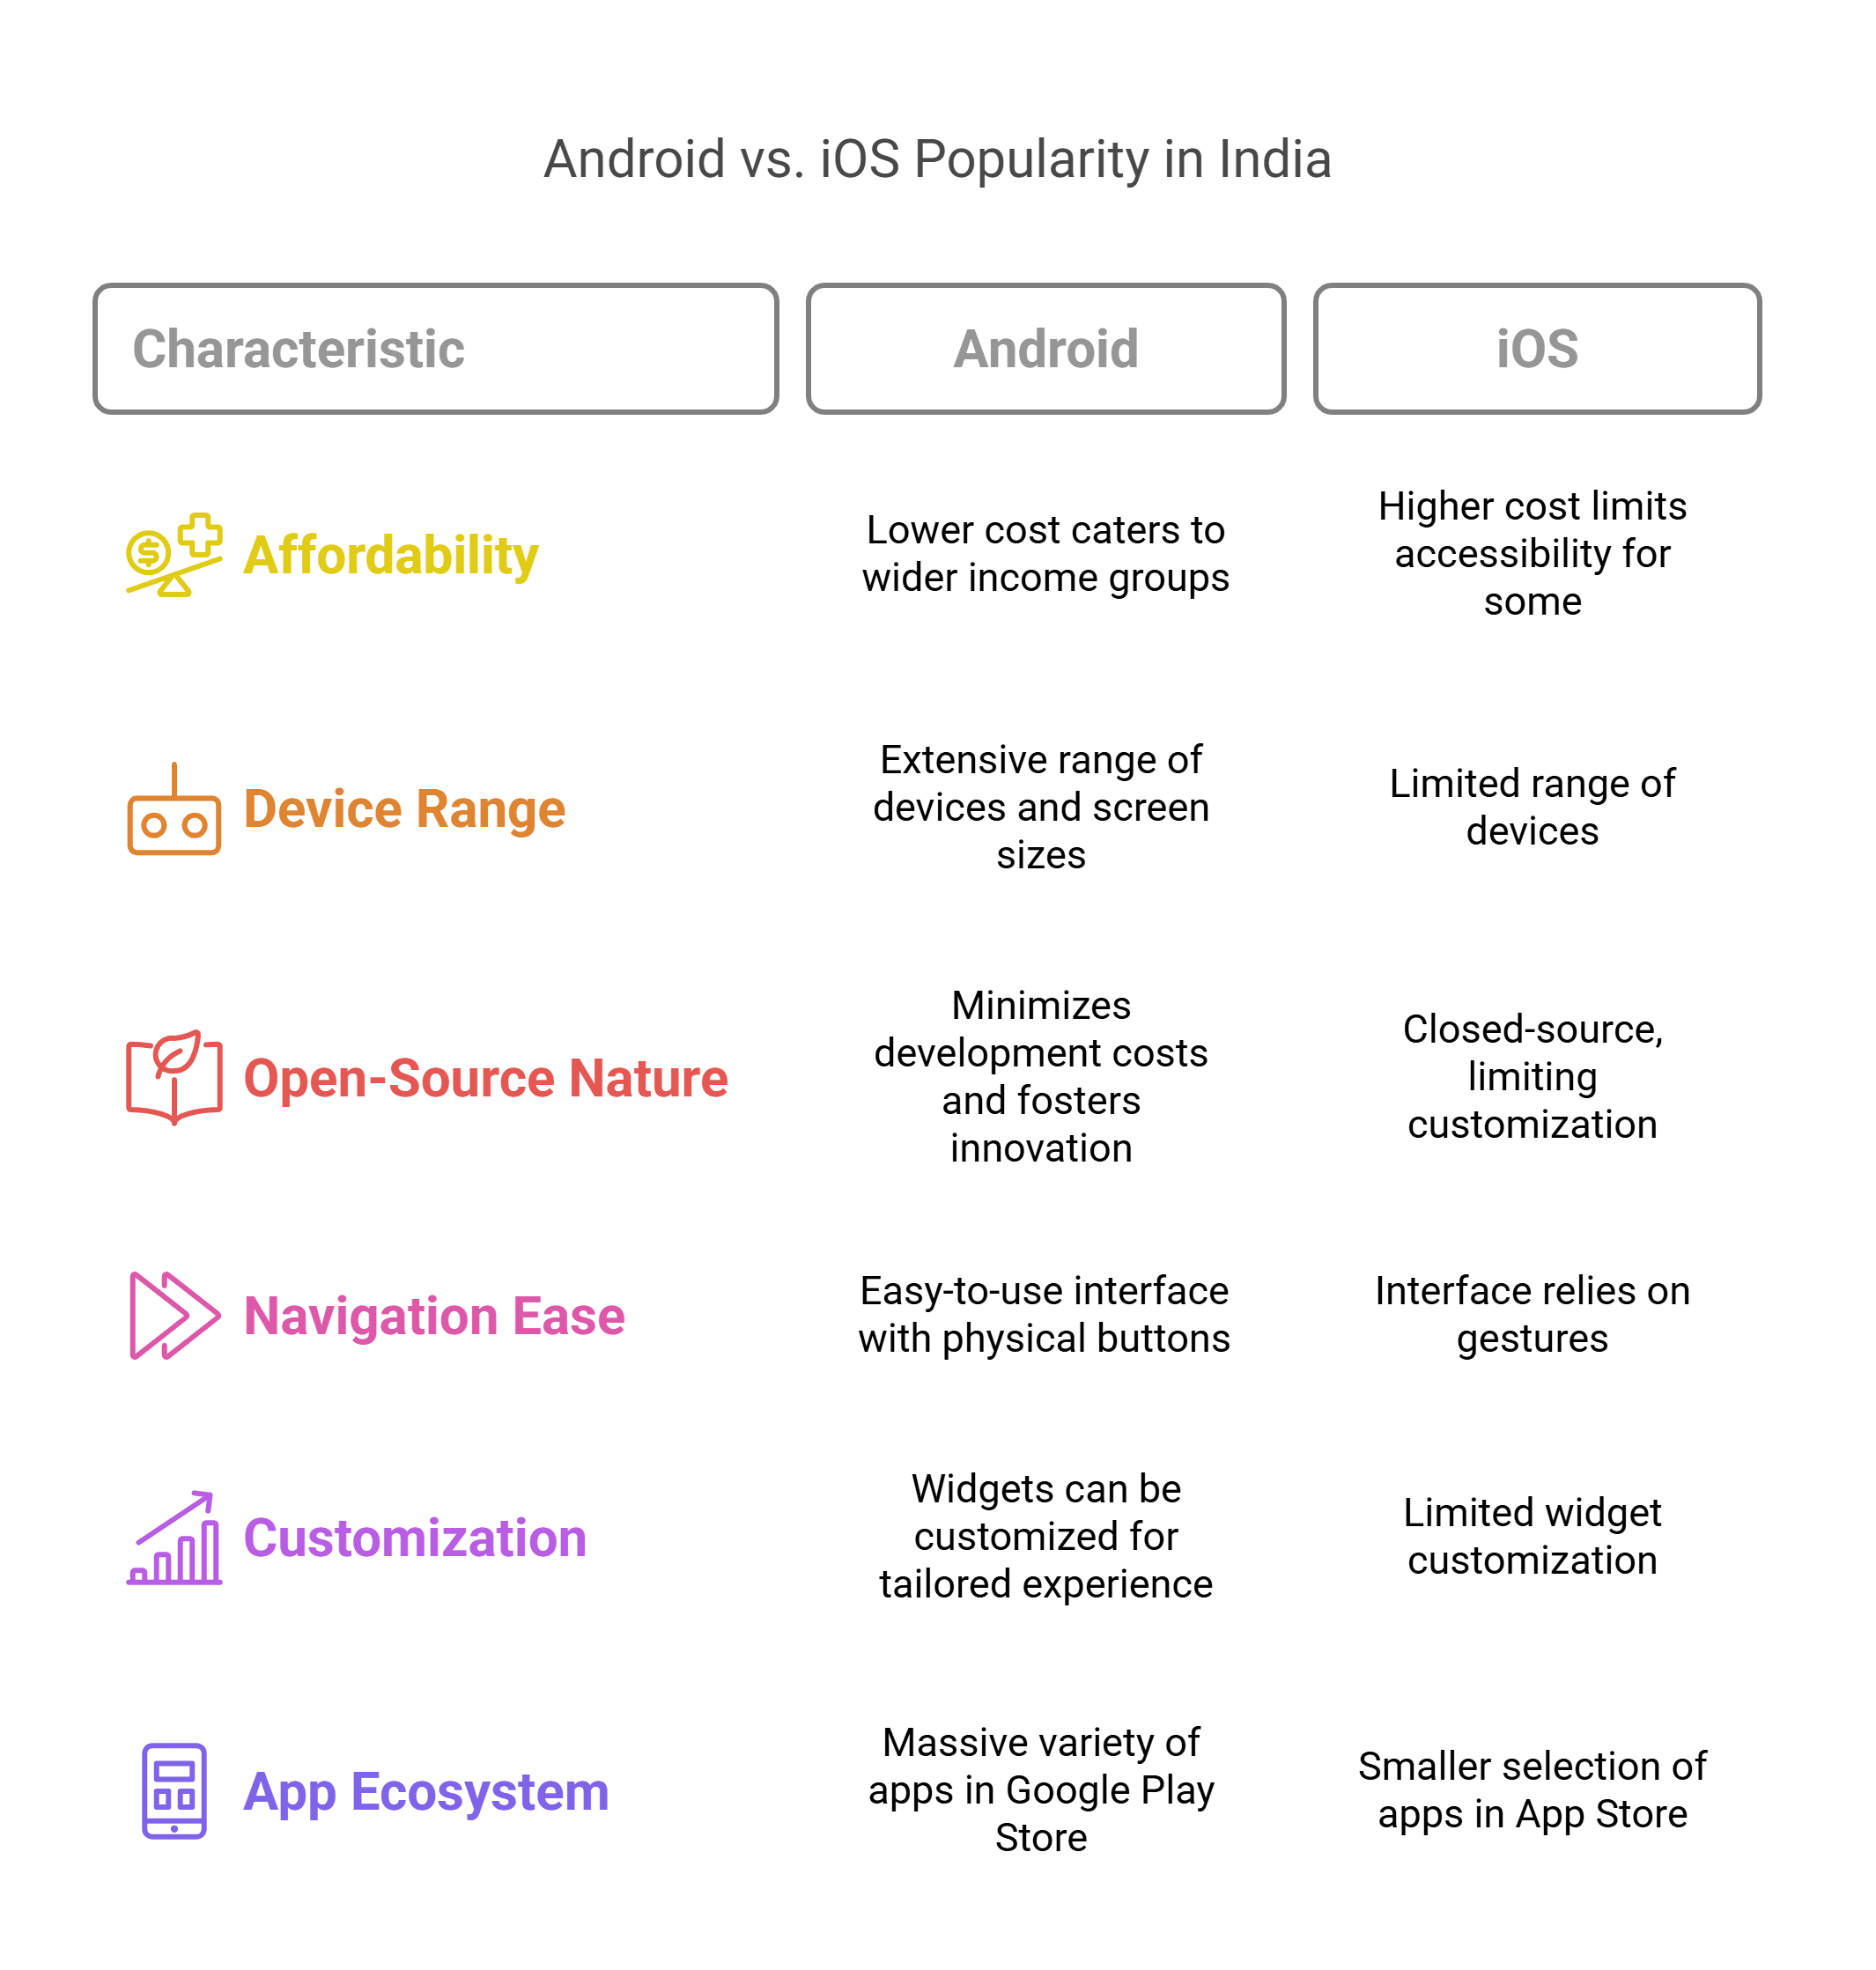
#7. Android is Favored in India with a 95% Market Share
Android enjoys a 94.81% market share in India because of its affordable devices, bespoke features, and ease of use, which cater to audiences of varying tech affinity. Older, non-tech-savvy people increasingly use the Android operating system, while millennials and GenX are most likely iPhone users.
And as India witnesses an increase in the number of senior citizens, nearly 300 million by 2050, app development companies should majorly focus on value creation.
Source: sciflare.com
#8. Older Generations Choose Android, While the Younger Generation Prefers iOS
Though Android has a wider fan following globally, younger generations like Gen Z and Millennials prefer the iPhone.
According to explodingtopics, 58% of users in the 18-34 age group favor iPhones, while 41% chose Androids.
The trend is in sync with US demographics, where younger people seem to like iPhones, more than Android.
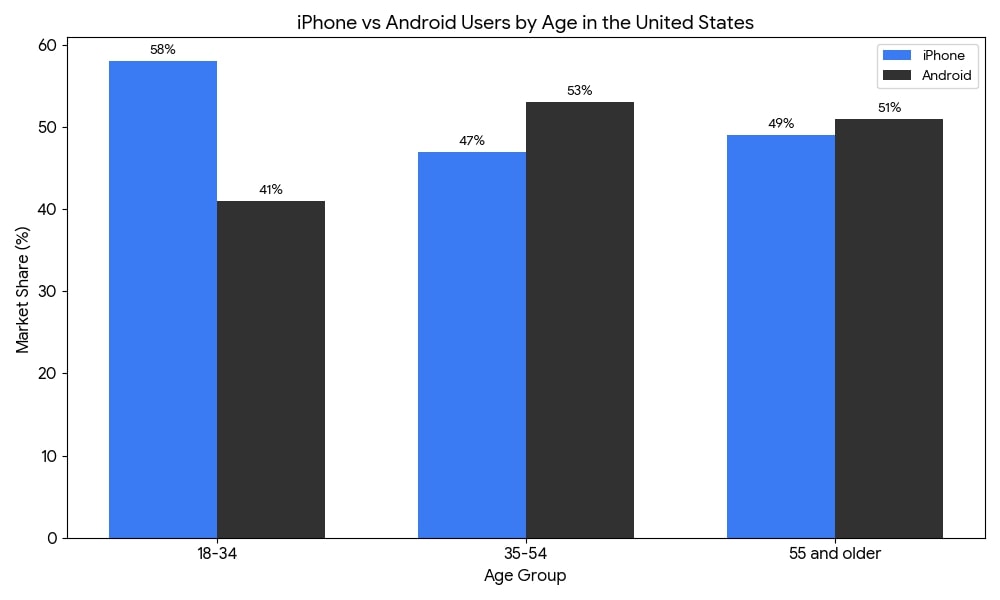
Table 6 highlights Gen Z’s interest in the iPhone, while older people prefer Android in the United States.
| Age | iPhone | Android |
| 18-34 | 58% | 41% |
| 35-54 | 47% | 53% |
| 55 and older | 49% | 51% |
Table 7 highlights iPhone Vs Android Users worldwide on an age basis
| Age | iPhone | Android |
| Gen Z | 31% | 57% |
| Millennial | 35% | 55% |
| Gen X | 22% | 60% |
| Baby Boomer | 23% | 55% |
One primary reason why Gen Zs are more inclined towards iPhones is that they prioritize camera quality over other features, and iPhones have advanced camera systems.
.jpg)
#9. Women prefer iPhones, while Men Prefer Android
Female users generally favor the iPhone over Android.
Table 8 highlights iPhone Vs. Android Users by gender worldwide
| Gender | iPhone | Android |
| Male | 28% | 60% |
| Female | 31% | 54% |
#10. Android has an 89-91% customer retention rate, while iPhone’s retention rate ranges from 85-88%
Not bad for both operating systems when it comes to customer retention rates. Android, with its 89-91% customer retention rate, and iPhone, with 85-88% retention rate, speak volumes about their high customer satisfaction rate.
Despite their impressive loyalty rates, a small percentage of users have switched sides. 18% of Android users switched to iPhone because it offers a great user experience, while 11% of Apple users switched to Android because of its affordability.
#11. Android Leads in Number of Apps and App Categories
In both app numbers and app categories, Android is ahead of iPhone. Google Play has 2.44 million apps, while the iPhone App Store has 1.9+ million apps. Plus, both Android and iPhone release over 1.2k new apps every day.
When it comes to categories, Android leads with 49 categories, while iPhone has 26.
Table 9: The table highlights total app numbers and app categories at Apple App Store and Google Play Store
| Platform | Apps (M) | Daily New Apps | Categories |
| App Store | 1.9 | 1.2K | 26 |
| Google Play | 2.44 | 1.2K | 49 |
#12. Basic App Development Cost is $10k-$50k in iOS due to Stricter Guidelines and Rigorous Testing
Simple app development cost is $10k - $50k in iOS due to stricter guidelines and rigorous testing, according to the Goodfirms app development cost survey. But then the best part is that the higher cost results in an 85% higher ROI than Android.
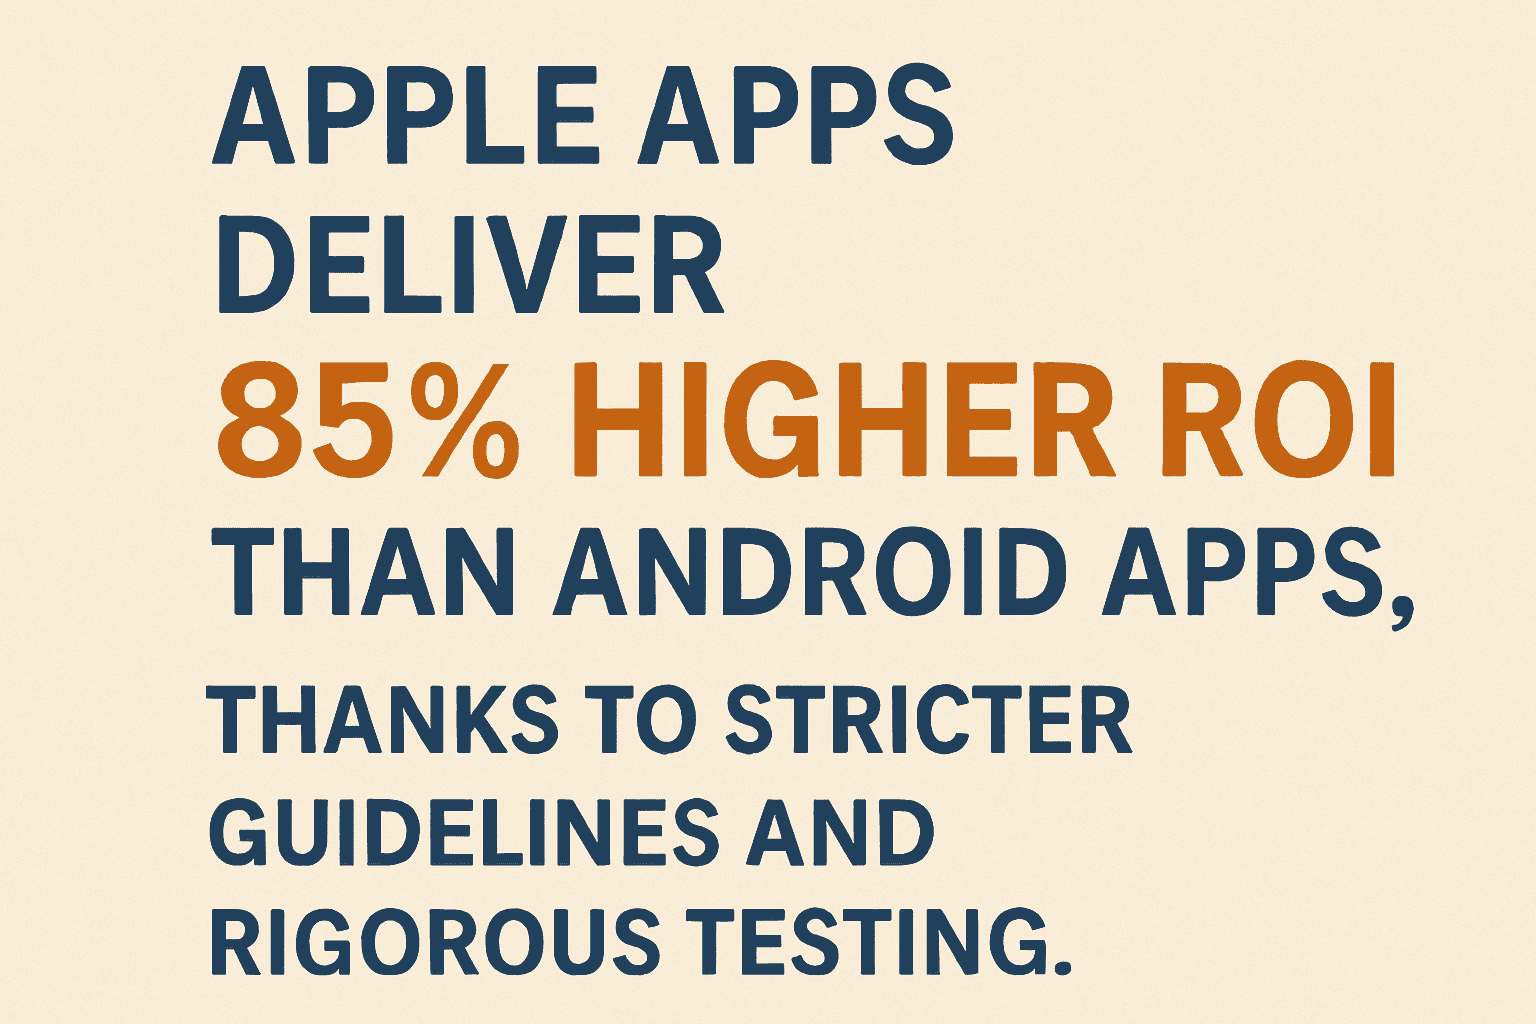
Thanks to the diversity in devices and OS versions, a basic Android app costs $5K to $15K, but these apps demand more testing.
#13. Apple shipped 10.1 Million Smartphones to China in Q2 2025, up 4% yoy and Ranking Fifth
Apple enjoyed pole position in China in Q4 2023, shipping 17.5 million units. Now, it has moved down to fifth position, yet it managed to ship 10.1 million smartphones in Q2 2025, which is considered a comeback for Apple.
Huawei, a rival to Android and iOS, is in the top spot. In Q2 2025, it shipped 12.2 million smartphones in China, a 15% year-over-year rise, and captured 18% of the market share.
Huawei, a rival to Android and iOS, is in the top spot. In Q2 2025, it shipped 12.2 million smartphones in China, a 15% year-over-year rise, and captured 18% of the market share.
#14. iOS Accounted for 68% of App Consumer Spending in 2024
Game consumer app spending in 2024 was 53%, while Google Play contributed 38%.
Though iOS has less than 20% of the market share, iOS app developers earn more than Android developers. This is mainly because the iPhone is popular in wealthier countries, such as Japan and the United States, where people spend more on apps.
In comparison, Google Play is popular in India, Southeast Asia, and South America, destinations known to generate less revenue. While Apple operates in China, the Google Play store is banned; however, third-party Android app stores are available in China and generate more than $25 billion in yearly revenue.
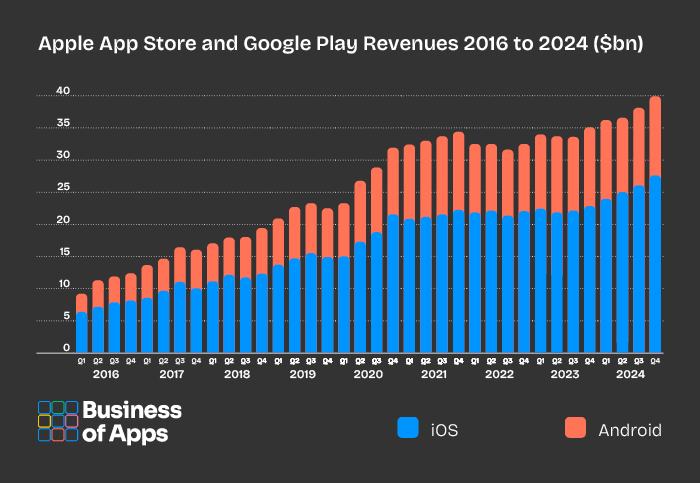
#15. Apple App Store generated $103.4 billion in revenue in 2024 in IAPs, surpassing Google Play’s $46.7 billion
In-app purchases (IAPs) drive major revenue for mobile applications, specifically for the Apple ecosystem. According to the App Data Report, the Apple App Store generated $103.4 billion in revenue in 2024, while Google Play stood at $46.7 billion.
Besides, subscription revenues touched $45.6 billion, with iOS generating 76%.
In-app purchases allow users to remove ads, subscribe to ongoing services and premium features, and even procure digital goods. With mobile app engagement growing, in-app purchases are no longer considered a monetization option but a strategic tool for sustainable hybrid app development, as highlighted in Goodfirms mobile app trends and opportunities.
#16. Top-Grossing iOS and Android games by Revenue
Table 10 highlights the top revenue-generating apps @ Apple App Store
iOS App Store (Top Games)
| Rank | Game | Estimated June 2025 Revenue |
| 1 | Last War Survival | Ranked #1 worldwide (Sensor Tower) |
| 2 | Candy Crush Saga | #2 in global mobile game revenue (Sensor Tower) |
| 3 | Honor of Kings | #3 globally (Sensor Tower) |
| 4 | Monopoly Go | Often in Top 5 across platforms |
| 5 | Whiteout Survival | #2 in mobile games revenue for the Android-specific list, but strong iOS too |
According to Sensor Tower, Last War: Survival was the #1 revenue game in June 2025 on iOS, followed by Candy Crush Saga and Honor of Kings.
Android (Google Play + selected markets) — Top Games
As per Singular and GameDevReports data, the top games that contribute to Android revenue rankings:
- Last War: Survival Game leads both in Android and iOS in revenue generation
- Other high performers: Whiteout Survival, HONOR of Kings, MONOPOLY GO!, RoyalMatch
June 2025 iOS & Android top game grosser: Last War: Survival
-
Strong performers across both platforms: Candy Crush Saga, Honor of Kings, MONOPOLY GO!, Whiteout Survival
Top non-game mobile apps in 2025 overall: ChatGPT, Disney+, Tinder, etc.
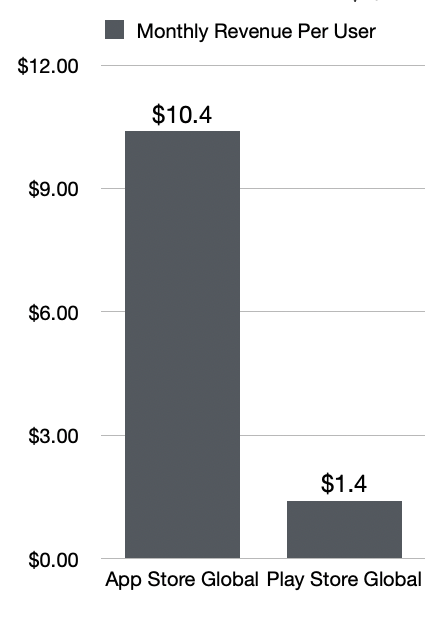
#17. iOS Users Spend Twice as much on Apps Monthly Compared to Android users
iOS users spend an average of $10.40 per app monthly, while Android users spend an average of $1.40 per app.
So, it comes as no surprise that the App Store generated over twice the revenue compared to the Google Play Store despite holding a smaller share of global device ownership.
The App Store's earnings were around $142 billion, compared to Google Play’s roughly $65 billion
Table 11 highlights average monthly spends by users and the 2025 app store revenues
Broader Market Context
|
Metric |
iOS | Android |
| Avg. monthly spend per user | $10.40 | $1.40 |
| Avg. spend per app transaction | $12.77 | $.619 |
| Average transaction value | $1.07 | $0.43 |
| Store revenue (2025 est.) | $142 B | $65 B |
Android holds over 70% of the global market share; however, it contributes only 30% of the total app store revenue. With larger disposable incomes and stronger in-app purchase habits among iOS users, developers find monetization efforts on Apple platforms more conducive.
#18. App Conversion Rates on both Operating Systems are Similar
Apple App Store has a 30% conversion rate, while Google Play has a 30.5% conversion rate.
When it comes to top categories, Apple’s top app category is navigation (104.5%), while Android’s top category is events (84.1%).
In-app purchases drive revenue for app developers, so the longer the app retention rates are, the better the chances of users making those purchases are.
Table 12 highlights how iPhone and Android stack against each other in terms of app retention
| Timeframe | iPhone App Retention Rate | Android App Retention Rate |
| Day 1 | 23.9% | 21.1% |
| Day 3 | 12.3% | 9.4% |
| Day 7 | 8.3% | 5.6% |
| Day 14 | 5.7% | 3.5% |
| Day 21 | 3.7% | 2.1% |
#19. iPhone Users have Higher Incomes than Android Users
If iPhone prices are any clue, iPhone users generally have higher incomes than Android users. iPhones start at $799 and more, while Android phones have a starting price of $286.
iPhone users tend to spend more at the Apple App Store, earning $103.4 billion in revenue in 2024 in IAPs, surpassing Google Play’s $46.7 billion. Further, the average monthly spend per user is $10.40 for iPhones, while it's $1.40 for Android phones.
All these figures arrive at a simple conclusion that Android devices are meant for lower incomes, while Apple has been designed for premium customers. The high price point is connected with high quality, and owning an iPhone is associated with a status symbol, attracting higher-income individuals who view iPhone purchase as a reflection of lifestyle and status.
#20. Android Boasts 3.9–4.5 billion active users worldwide, compared to iOS’s 1.46–1.8 billion, reflecting Android’s open-source appeal
A large chunk of smartphone users worldwide prefer Android over iPhone.
This is because Android is open-source software that can be easily installed on any smartphone device, thus allowing manufacturers to download and adapt the software for their devices. This facility has prompted many manufacturers, such as Huawei, Google, and Samsung, to produce Android devices and offer options in price, features, and design.
The diversity contributes to Android’s large market share.
#21. Android users are more likely to opt for push notifications with an 81% open rate
Android users have a higher push notification opt-in rate of 81%, while iOS users have a meager 51%. The response rate for Android is 4.6% vs 3.4% for iOS.
Android users click more push notifications than iPhone users because iOS doesn’t allow apps to opt in for push notifications, while Android does automatically.
Conclusion: Android for the Masses, iPhone for the Classes
Both operating systems are holding their ground and catering to distinct market segments. Android’s advantages, such as being open-source, affordable, and diverse in terms of devices, have allowed this operating system to enjoy widespread reach and high download volumes.
iPhone, on the other hand, is a premium brand with a closed, highly controlled ecosystem that offers a high-quality user experience and a streamlined app economy targeting wealthier nations. This results in higher user spending and app store revenues.
This clear-cut division ensures that two platforms aren’t directly competing for the same customers everywhere; instead, they are defining their lanes. Android seeks out the common man, while Apple aims to target the upper echelon with high-end lifestyles. These differences mean the rivalry will be less about which platform wins and more about which one dominates in their respective markets.
Sources:
- https://explodingtopics.com/blog/iphone-android-users
- https://gs.statcounter.com/os-market-share/mobile/worldwide
- https://www.asymco.com/2023/09/05/the-value-of-a-customer/
- https://www.counterpointresearch.com/insight/japan-smartphone-market-q1-2025/
- https://www.businessofapps.com/data/app-revenues/
- https://gamedevreports.substack.com/p/appmagic-top-mobile-games-by-revenue-f85
- https://www.singular.net/blog/top-mobile-games/
- https://www.cnbc.com/2025/07/28/apple-returns-to-growth-in-china-huawei-reclaims-top-smartphone-spot.html
- https://www.pcmag.com/news/ios-more-popular-in-japan-and-us-android-dominates-in-china-and-india
- https://www.demandsage.com/iphone-user-statistics/
- https://www.goodfirms.co/resources/mobile-app-development-trends-opportunities
- https://www.sensortower.com/blog/top10-worldwide-mobile-games-revenue-downloads-june-2025