Key takeaways
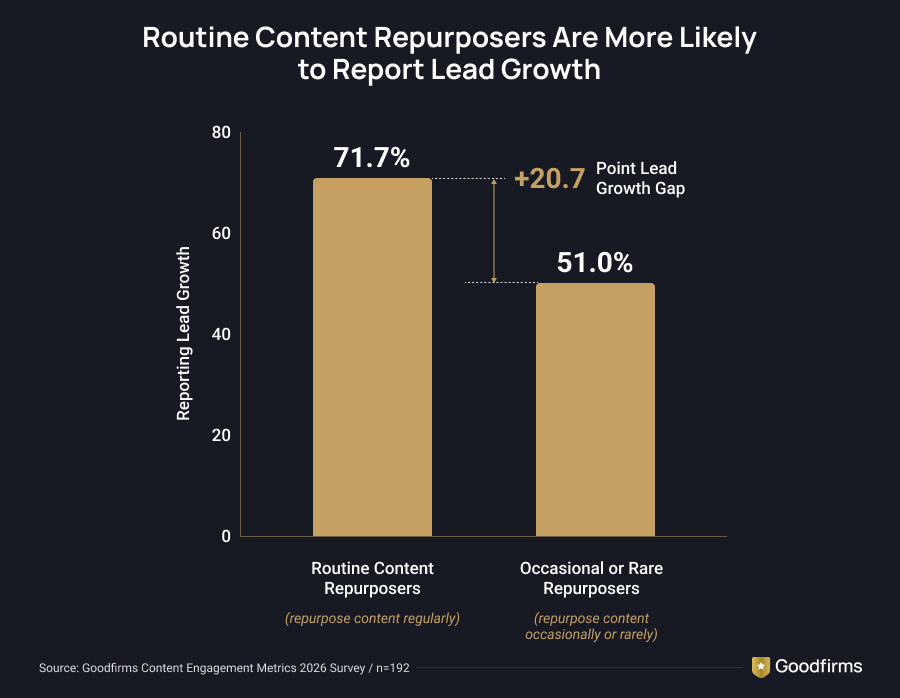
- 71.7% of routine repurposers report lead growth, compared with 51% of occasional or rare repurposers.
- 74.4% of extensive AI users report lead growth, compared with 50.9% of other marketers.
- 75.8% of outcome-focused marketers report lead growth, compared with 52.4% of others.
- 69.4% of brand authority investors report lead growth, compared with 51.1% of others.
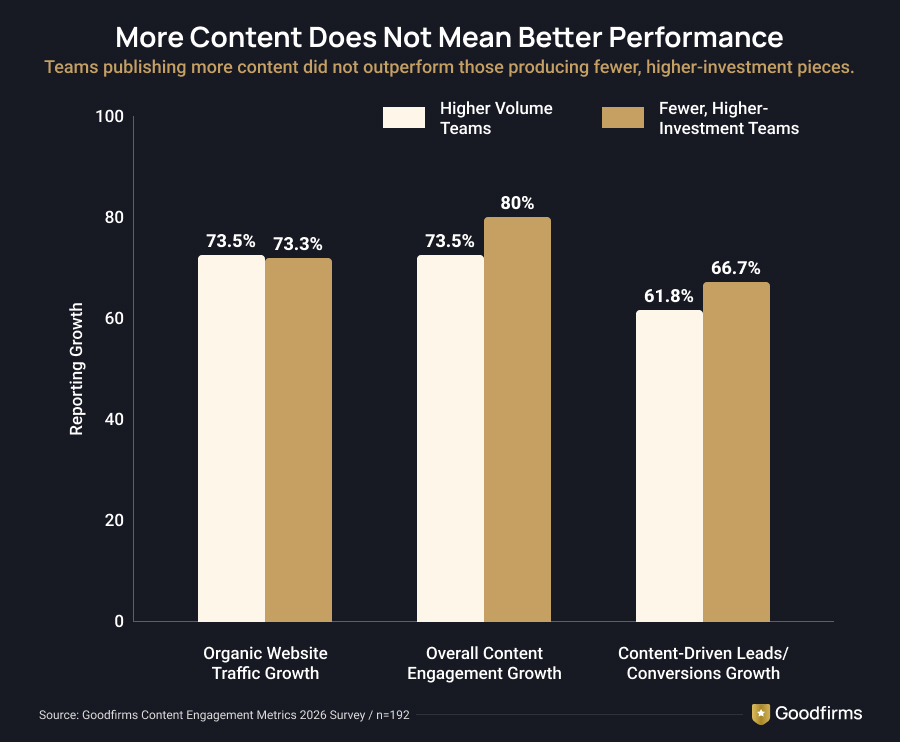
- Publishing more content did not lead to stronger traffic growth: 73.5% of higher-volume teams reported growth, compared with 73.3% of teams producing fewer, more heavily invested pieces.
- 82.6% use AI regularly or extensively in their content marketing workflows.
- 65.2% say AI search and answer engines have become more important distribution channels.
- 55.4% plan distribution before content creation begins.
What Is Content Engagement?
Content engagement is how an audience interacts with content and whether that interaction progresses from attention to meaningful action.
It can include website visits, reading time, clicks, shares, comments, subscriptions, return visits, leads, conversions, and purchases.
How Content Engagement Is Measured: Three Levels
| Level | What it captures | Example content engagement metrics |
|---|---|---|
| Attention | Whether content was discovered | Traffic, impressions, reach, visibility |
| Interaction | Whether the audience responded | Clicks, engaged time, return visits, subscriptions, comments, shares |
| Outcome | Whether the interaction produced value | Leads, conversions, pipeline, sales, revenue, retention |
The appropriate metrics depend on the job the content was created to perform. The findings below show how practitioners apply this framework in practice.
Introduction
We expected 2026 to be a bad year for content engagement.
More so, with mounting evidence suggesting that Google’s AI-driven search experience is hamstringing website clicks and changing how people discover information.
Consider this: Ahrefs, after analyzing 300,000 keywords, found that Google AI Overviews led to a 34.5% lower average click-through rate for the top-ranking page. Pew Research Center reported that users clicked a traditional search result on 8% of visits when an AI summary appeared, compared with 15% when no AI summary appeared.
Links cited inside the AI summary itself drew clicks on only 1% of visits.
To put it in perspective, fewer clicks should have meant weaker traffic, lower engagement, and fewer leads.
But our survey of 192 content marketing professionals found the opposite.
A majority reported a reasonable growth in organic traffic (66.3%), content engagement (63%), and content-driven leads or conversions (60.9%).
Search is changing, but our survey data shows that content performance is not simply declining with it.
More importantly, the biggest differences in this study appear not in whether marketers produce content, but in how they distribute it, repurpose it, use AI, build authority, and connect content activity to business outcomes.
#ContentEngagementScandal: 66.3% Report Organic Traffic Growth Despite AI Search Disruption
This is one finding that totally caught us off guard: 66.3% of respondents reported organic traffic growth over the past 12 months.
That is especially surprising given the "SEO-Traffic-Tanking" sentiment widespread in the industry. But this sentiment is partially true given what is happening in the publishing industry.
A 2026 Growth Memo analysis of Similarweb data containing the traffic channel mix of 10,000 US and French domains found that publishers lost roughly 42% of their organic traffic over two years — 41.5% in the US and 42.5% in France. Publishers appear particularly exposed because their core product — content and information — increasingly competes with AI-generated answers.
When our respondents reported growth across the content funnel, it became clear that the broader “SEO traffic is collapsing” narrative may be too blunt to describe what is actually happening across the market.
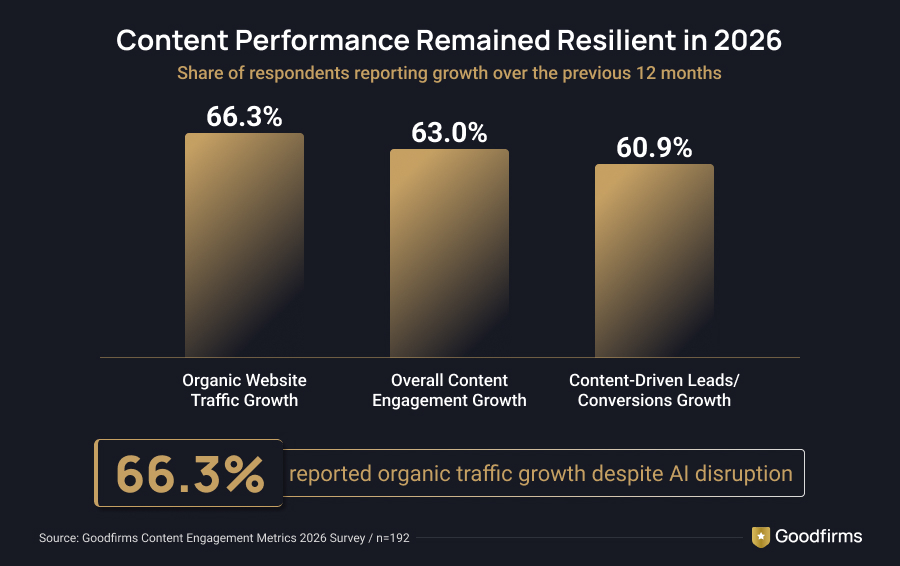
| Outcome | Significant increase | Some increase | Combined |
|---|---|---|---|
| Organic website traffic | 38% | 28.3% | 66.3% |
| Overall content engagement growth | 22.8% | 40.2% | 63% |
| Content-driven leads/conversions | 25% | 35.9% | 60.9% |
A further 21.7% reported that engagement remained approximately unchanged.
The contrast suggests that AI search disruption is not affecting every type of organization equally. Businesses built primarily around publishing information may be under far greater pressure than businesses using content to build authority, support products or services, and generate leads.
This does not mean AI search is harmless to organic traffic. It shows that even as traditional publishing faces significant pressure, content performance is not declining across the board.
65.2% Say AI Search Is Emerging as a New Content Discovery and Distribution Channel
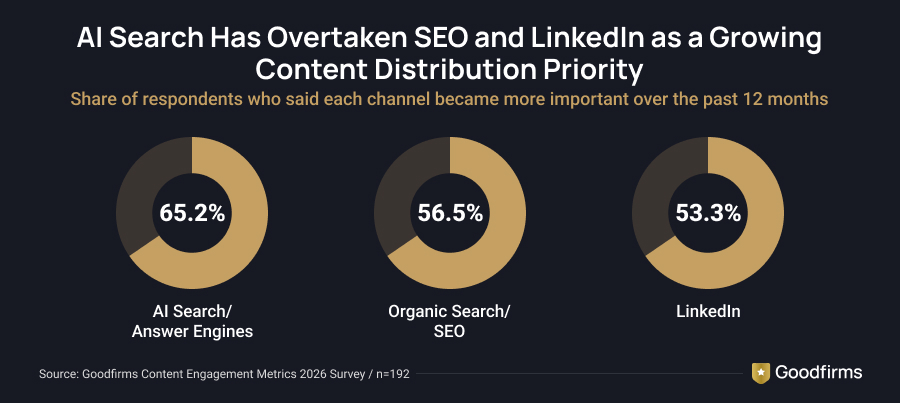
65.2% said AI search or answer engines became more important to content distribution over the previous 12 months.
That compares with:
- Organic search/SEO: 56.5%
- LinkedIn: 53.3%
A buyer can now encounter a company's idea in an AI Overview, ChatGPT answer, Perplexity citation, LinkedIn article, Reddit discussion, review site, or third-party article without visiting the company's website.
Md Israr Alam of Carney Technologies Services noted that “Visibility and traffic are no longer the same thing.”
The shift matters because influence can increasingly occur before, or even without, a measurable website visit.
60.9% Are Optimizing Content for AI Search and Answer Engines
The strategies accompanying that effort include:
- Prioritizing expert-led or firsthand content: 58.7%
- Investing more in brand-building and authority: 57.6%
- Producing more original research or proprietary data: 47.8%
- Updating existing content more frequently: 37%
- Diversifying content distribution: 31.5%
- Focusing more on conversions and business outcomes: 30.4%
These are primarily strategies of authority, originality, and evidence, rather than purely technical optimization tactics.
Matt Dean of Dean Design described an environment where information is abundant, but perspective is scarce.
The differentiator is increasingly what an organization can say from its own experience rather than what it can summarize from everyone else's.

Marketers Are Moving Beyond Traffic to Business Outcomes
Content engagement measurement is shifting from simply counting attention toward understanding whether content prompts action and contributes to business results. The following findings show what marketers consider meaningful engagement, which metrics they trust, and where attribution still falls short.
60.9% Say Meaningful Content Engagement Means Moving Audiences Toward Action
When asked which behaviors count as meaningful engagement, respondents ranked action-oriented behaviors highest:
- Providing information or becoming a lead: 60.9%
- Taking a conversion or purchase action: 59.8%
- Clicking through or taking a next step: 54.3%
- Spending meaningful time with content: 46.7%
Social and passive signals ranked lower:
- Commenting or joining a conversation: 33.7%
- Subscribing or following: 32.6%
- Returning for more content: 29.3%
- Sharing or recommending: 28.3%
- Saving or bookmarking: 9.8%
Attention metrics have not been abandoned, but respondents place more weight on what happens after attention is earned.
As Tom Bukevicius of Scube Marketing put it: “Page views alone do not tell us much.”
His team also weighs time on key sections, clicks, return visits, branded searches, and whether content prompts a next step.
63% Measure Content Engagement to Improve Lead Generation and Nurturing
The leading reason for measuring engagement was to improve lead generation and nurturing (63%).
Improving content topics or quality and improving conversions or business outcomes were each cited by 52.2%.
Measurement, therefore, appears to function less as reporting alone and more as an input to commercial and content decisions.
81.5% Track Traffic, but Leads and Revenue Carry More Weight
The most commonly tracked content engagement metrics are:
- Website traffic or pageviews: 81.5%
- Clicks or CTR: 65.2%
- Form submissions or leads: 58.7%
- Engaged time: 56.5%
- CTA conversions: 53.3%
Each metric answers a different question: whether content attracted an audience, whether it held attention, and whether it moved the audience toward a result.
Traffic appears to be treated as the start of the performance story, not the end of it.
38% Say Leads Are the Strongest Evidence That Content Is Working
Asked to identify the strongest indicator that content worked:
- 38% selected leads or form submissions.
- 22.8% selected conversions or revenue.
What marketers track most frequently is therefore not necessarily what they consider most conclusive.
Traffic remains the most visible metric, but leads and revenue carry more weight when judging whether content actually produced value.
Only 26.1% Connect Content Engagement to Business Outcomes Very Effectively
Only 26.1% connect content engagement to business outcomes very effectively across most content and channels.
Another:
- 38% do so somewhat effectively.
- 28.3% can connect the two only for certain content or channels.
This creates a clear attribution gap.
Marketers increasingly want to evaluate content through commercial outcomes, but most still struggle to connect engagement signals with eventual business results.
Trevor Stewart of Let's Get Optimized described tracking calls and form submissions to their source, following those leads through qualified opportunities, customers, and revenue, and
using that information to decide which topics and formats merit more investment.
31.5% Use Engagement Data From Awareness Through Conversion
31.5% use engagement data from awareness through lead generation or conversion.
Another:
- 18.5% use it across awareness and consideration.
- Only 8.7% do not map engagement to the buyer journey.
This matters in B2B, where a buyer may discover an article, return through branded search, read a case study, ask an AI assistant to compare vendors, review pricing, and then contact sales.
Analytics may log several sessions for what the buyer experiences as one decision journey.
39.1% Primarily Judge Content Success Through Business Outcomes
39.1% primarily judge content engagement success through leads, conversions, revenue, or another business outcome.
Another:
- 30.4% compare performance against their own historical results.
- 13% rely on predefined internal KPIs or targets.
Traffic, CTR, engagement time, rankings, and AI citations remain useful, but increasingly as signals on the way to an outcome.
Publishing More Content Is Not Translating Into Better Performance
Content volume alone does not appear to separate stronger-performing teams from the rest. The data instead points toward a broader trade-off between publishing frequency, investment per asset, content quality, and the formats audiences find most valuable.
37% Are Producing More Content, While Others Are Investing More in Fewer or Better Pieces
Respondents reported different approaches to production:
- Producing more content overall: 37%
- Same volume, higher investment in quality: 30.4%
- Fewer pieces, more investment in each: 16.3%
In total, 46.7% are holding or reducing volume while emphasizing quality.
Monthly output also varies considerably:
- 1–5 pieces: 19.6%
- 6–10 pieces: 19.6%
- 11–25 pieces: 19.6%
- 26–50 pieces: 17.4%
- More than 50 pieces: 13%
In all, 30.4% publish more than 25 pieces per month, while 19.6% publish five or fewer.
Publishing frequency matters far less than having something worth reading, quoting or sharing. Clare Jones — Global Outreach Manager @ Custom Neon
“Content” here includes articles, emails, social posts, videos, podcasts, webinars, reports, and campaign assets.
Publishing More Content Does Not Correspond With Stronger Traffic Growth
Reported growth by strategy:
| Strategy | Traffic | Engagement | Leads/conversions |
|---|---|---|---|
| More content overall | 73.5% | 73.5% | 61.8% |
| Fewer pieces, higher investment | 73.3% | 80% | 66.7% |
Traffic growth was almost identical between the two groups.
Teams publishing fewer, more heavily invested pieces reported somewhat stronger engagement and lead/conversion growth.
The data give little support to the idea that publishing more, on its own, yields better results.
They do not prove the opposite either. The fewer-pieces subgroup is relatively small, so the difference may be directional rather than definitive.
The more useful question may therefore be what each piece contributes, not how many pieces are published.
73.9% Say Blogs and Articles Generate the Strongest Engagement
Respondents identified their strongest content formats as:
- Blogs and articles: 73.9%
- Case studies: 47.8%
- Social media content: 33.7%
- Original research and reports: 28.3%
- Short-form video: 28.3%
This should not be read as a defense of generic SEO content.
AI has made basic explanations cheaper to produce and easier to summarize, which increases the value of information that cannot be cheaply recreated.

Colleen Barry of Ketch said: “Original insight matters more than simply covering a topic.”
Her team adds campaign data, examples, expert opinion, and practical lessons.
Fırat Mıhcı, Founder of HumanizeMy.ai, offers a strong example of why verifiable original research travels further:
“In 2026 the content that travels is the content a stranger can verify. Our study of 18,989 abstracts reached TechRadar Pro, Yahoo Tech and MSN without a single ad, because anyone could rerun the numbers.” Fırat Mıhcı, Founder of HumanizeMy.ai
Mıhcı described publishing studies built on checkable data, with enough methodology for outsiders to reproduce the findings, giving journalists, researchers, and publishers something they can cite with confidence.
22.8% Say Standing Out Is Their Biggest Content Engagement Challenge
The top challenges were:
- Standing out in an overcrowded content environment: 22.8%
- AI search or zero-click discovery: 16.3%
- Consistently creating high-quality content: 14.1%
- Connecting engagement with revenue or ROI: 14.1%
The common theme is distinctiveness rather than production capacity.
As Justin Herring of YEAH! Local said: “People are much less willing to spend time with content that feels generic.”
Distribution and Repurposing Are Emerging as Performance Multipliers
How content reaches its audience appears to matter almost as much as what gets created. Teams are increasingly designing distribution into the content process and extending core assets across formats and channels rather than treating promotion as an afterthought.
55.4% Plan Distribution Before Content Creation Begins
55.4% decide how content will be distributed before content creation begins.
Another 19.6% develop distribution and content decisions together during creation. Only 10.9% create content first and decide on promotion afterward.
This matters because the channel influences the format.
PR-bound research needs newsworthy findings.
LinkedIn needs a concise argument.
Sales assets need proof and objection handling.
Search content must satisfy intent.
AI-search content benefits from direct answers and verifiable information.

Distribution is therefore increasingly becoming part of content design rather than simply the final promotional step.
38% Still Repurpose Content Only Occasionally
Repurposing practices remain uneven:
- Occasional repurposing: 38%
- Regular adaptation into two or three additional formats: 21.7%
- Repurposing as part of the standard workflow: 19.6%
- Systematic design of core content for multi-channel adaptation: 9.8%
The more revealing result appears when these practices are compared with reported outcomes.
Routine Repurposers Report a 20.7% Lead-Growth Advantage
| Group | Engagement growth | Lead/conversion growth |
|---|---|---|
| Routine repurposers | 80.4% | 71.7% |
| Occasional/rare repurposers | 65.3% | 51% |
Routine repurposers reported lead/conversion growth 20.7 percentage points more often than occasional or rare repurposers.
They also reported engagement growth 15.1 percentage points more often.
The relationship is directional and does not prove that repurposing caused the growth.
More mature content organizations may simply be more likely to repurpose systematically and perform better for other reasons.
Still, the size of the gap supports treating repurposing as a system rather than an afterthought.
AI Adoption, Brand Authority, and Outcome Focus Are Linked to Stronger Down-Funnel Results
Teams using AI extensively, investing in brand authority, and focusing more on business outcomes reported stronger engagement and lead growth. These findings show a clear performance pattern, although other factors may also have contributed to the results.
82.6% Use AI Regularly or Extensively in Content Marketing
41.3% use AI extensively across multiple areas of their content marketing workflow.
Another 41.3% use it regularly for selected activities.
Combined, 82.6% use AI regularly or extensively.
Qualitative responses described a hybrid model:
AI for efficiency; people for experience, judgment, expertise, opinion, and evidence.
Jounayet Rahman of Xceed Bangladesh Ltd. noted: “AI amplifies content value only when original knowledge and meaningful expertise back it up.”
Extensive AI Users Report a 23.5-Point Lead-Growth Advantage
| Group | Engagement growth | Lead/conversion growth |
|---|---|---|
| Extensive AI users | 84.6% | 74.4% |
| Others | 63.2% | 50.9% |
Extensive AI users reported engagement growth approximately 21.4 percentage points more often and lead/conversion growth approximately 23.5 percentage points more often.
The difference in traffic growth was much smaller.
That means the stronger association appears further down the funnel rather than in raw organic visibility.
This is not evidence that AI caused stronger performance.
More mature content organizations may simply be more likely to use AI extensively while also having stronger strategy, distribution, attribution, and conversion systems.
Brand Authority Investors Report 69.4% Lead Growth vs. 51.1%
| Outcome | Investing more in brand authority | Did not select |
|---|---|---|
| Organic traffic growth | 73.5% | 57.4% |
| Engagement growth | 77.6% | 66% |
| Lead/conversion growth | 69.4% | 51.1% |
The lead-growth gap exceeds 18 percentage points.
This does not show that brand authority causes leads.
However, it challenges the idea that brand investment and performance marketing are entirely separate.
Rohit Bhateja of SunTec India sees the same shift toward demonstrable authority. As AI lowers the barrier to content creation, he argues that the tools themselves are no longer a competitive advantage. What is harder to replicate is practical experience, original expertise, client success stories, measurable outcomes, and insights grounded in real-world work.
In an AI-search environment, authority may influence both whether a brand is surfaced and whether the audience trusts what it finds.
Teams Focusing on Business Outcomes Report 75.8% Lead Growth vs. 52.4%
Among respondents who shifted toward conversions and business outcomes, 75.8% reported lead/conversion growth.
Among those who did not, 52.4% reported growth.
That represents a gap of approximately 23.4 percentage points.
This is an association.
Organizations that already perform strongly may simply have more sophisticated outcome measurement.
Still, it reinforces the broader pattern that stronger downstream performance tends to appear among teams combining technology with more mature content and measurement practices.
Ana Costa of SmartLinks described what that shift looks like in measurement. Her team has moved beyond relying on pageviews or time on page alone and now connects content performance with CRM data, including which pieces touched a deal before it closed and at what stage. That has also pushed their content strategy toward buyer intent and sales stage rather than keyword volume alone.
Audience Insight Is Replacing Keyword Volume as the Starting Point
Search demand still matters, but marketers are increasingly combining it with deeper audience signals to decide what content should address and whom it should serve. Pain points, intent, personalization, and first-party data are becoming part of the same planning system.
76.1% Use Audience Pain Points to Shape Content Strategy
The leading inputs into content planning are:
- Audience pain points, needs, or challenges: 76.1%
- Search intent: 72.8%
- Questions or topics the audience cares about: 55.4%
- Long-tail or conversational queries: 39.1%
- Search trends or emerging queries: 33.7%
Keywords remain relevant, but their role is changing.
A keyword indicates that demand exists.
Intent and pain points explain why that demand exists and what the audience needs solved.
Miguel Cairo of Miami SEO Nerdz described how this changes the content itself. His team has moved away from chasing publishing volume and instead focuses on specific services, locations, and real customer questions. His test is simple: if a company in another state could publish essentially the same page, the content probably does not demonstrate enough real local expertise.
67.4% Personalize Content Across Segments or Journey Stages
45.7% personalize content moderately for important audience segments.
Another 21.7% use extensive personalization.
Combined, 67.4% personalize content in some meaningful way.
In practice, personalization often means recognizing that technical buyers, finance stakeholders, early-stage researchers, and vendor comparers need different information rather than attempting one-to-one personalization at scale.
76.1% Use Search and Query Data as a First-Party Content Signal
The most commonly used first-party signals include:
- Search or query data: 76.1%
- Website behavioral data: 71.7%
- Form or lead-capture data: 42.4%
- Social engagement data: 41.3%
- CRM or lead data: 41.3%
Customer and purchase information, interviews, direct feedback, and email engagement also featured.
Each source answers a different question:
What are people asking?
What do they consume?
Who raises a hand?
Which interest becomes a qualified opportunity?
What eventually creates value?
The opportunity lies in connecting these signals, not simply collecting more of them.
32.6% Say Lead Generation Is Their Primary Content Outcome
Asked for the main result content that should be achieved:
- Lead generation: 32.6%
- Trust or authority: 23.9%
- Audience education: 16.3%
- Brand awareness or reach: 14.1%
Leads and trust are closely linked. Content often has to establish credibility, reduce uncertainty, or answer objections before a buyer acts.
Dr. Rizwan Tai, a podiatrist and foot and ankle surgeon in Houston, reported a similar pattern in another sector: patients respond more readily to simple, authentic explanations and real stories than to polished marketing alone.
63.1% Often or Always Use Engagement Data to Shape Future Decisions
37% often use engagement data to influence major content decisions. Another 26.1% always do so.
Combined, 63.1% frequently use engagement information to shape future decisions, while another 28.3% do so sometimes.
This forms a feedback loop:
Create → distribute → measure → learn → improve
Ethan Marsh of Freeman NYC cautioned that measurement itself must be validated before teams optimize against it. In one audit, he described a configuration issue that made engagement rates look unusually strong even for clearly low-quality traffic.
Better measurement, therefore, requires not only more data but confidence that the data itself is trustworthy.
What Successful Content Engagement Looks Like in 2026
The data do not support one universal content engagement metric.
Instead, they support a sequence:
1. Attention: Was the content discovered?
2. Engagement: Did the audience interact?
3. Trust: Did they find it credible and useful?
4. Action: Did they move forward?
5. Outcome: Did that action contribute to a meaningful objective?
Different assets perform different jobs.
A research report, LinkedIn post, product page, newsletter, and case study should therefore not be judged by the same number.
Anand Pohankar, Founder of Parivartan Software And Multimedia Pvt Ltd., described a similar shift away from traffic and visibility alone toward content that establishes authority and drives action. His takeaway: successful content should be useful, credible, and created with a clear business objective in mind.
A million impressions, a thousand visits, or an AI citation can still fail to serve a business objective.
At the same time, a piece with modest traffic may be highly valuable if it earns a citation, answers an important buyer question, generates a qualified lead, or continues supporting sales months later.
The central implication of this study is therefore simple: Teams should define what content is supposed to accomplish before judging whether it performed.
Conclusion
The 2026 content environment is not simply a story of declining clicks or increasing AI use.
The more significant change is how content teams are connecting discovery, distribution, authority, engagement, and business outcomes.
Traffic remains important.
Blogs remain effective.
AI has become mainstream.
- But the strongest patterns in this study appear deeper in the content operation:
- Routine repurposers report substantially stronger lead growth than occasional or rare repurposers.
- Extensive AI users report stronger engagement and lead growth than other respondents.
- Organizations investing in brand authority report stronger traffic, engagement, and lead growth.
- Teams focusing more heavily on business outcomes report substantially higher lead growth.
- Publishing more content, on its own, shows little advantage over producing fewer, more heavily invested pieces.
None of these relationships prove causation.
Together, however, they suggest that content maturity in 2026 is less about producing more and more about creating a connected system around audience insight, original value, distribution, authority, measurement, and outcomes.
FAQs - Content Engagement Metrics
How do you measure content engagement?
A useful framework measures three levels:
Attention: traffic, impressions, reach, visibility
Interaction: clicks, engagement time, return visits, subscriptions, comments, shares
Outcome: leads, conversions, pipeline, sales, revenue, retention
The appropriate content engagement metrics depend on the job the content was created to perform.
What are the most important content engagement metrics?
In this survey:
- 81.5% track website traffic or pageviews.
- 65.2% track clicks or CTR.
- 58.7% track form submissions or leads.
- 56.5% track engaged time.
- 53.3% track CTA conversions.
The strongest measurement systems connect these interaction signals with eventual business outcomes.
Which content formats generate the most engagement?
Blogs and articles rank first at 73.9%, followed by case studies at 47.8%, social media content at 33.7%, and original research/reports and short-form video at 28.3% each.
Does publishing more content improve performance?
The survey does not show a clear advantage.
Teams producing more content reported traffic growth at 73.5%, compared with 73.3% among teams producing fewer, more heavily invested pieces.
The fewer-pieces group reported somewhat stronger engagement and lead/conversion growth, although the subgroup is too small to establish causation.
Does content repurposing correlate with better results?
Routine repurposers reported:
- Engagement growth: 80.4%
- Lead/conversion growth: 71.7%
Occasional or rare repurposers reported:
- Engagement growth: 65.3%
- Lead/conversion growth: 51%
The relationship is an association, not proof that repurposing directly caused better outcomes.
How is AI changing content marketing?
82.6% of respondents use AI regularly or extensively.
At the same time:
- 65.2% say AI search is becoming a more important distribution channel.
- 60.9% optimize content for AI search or answer engines.
- 58.7% are prioritizing expert-led or firsthand content.
- 57.6% are investing more in brand authority.
- 47.8% are producing more proprietary information or original research.
Does content engagement affect content marketing ROI?
It can, but attribution remains a major challenge.
Only 26.1% say they connect engagement to business outcomes very effectively, although 39.1% primarily judge success through leads, conversions, revenue, or another business outcome.
Research Methodology
Goodfirms' Content Engagement 2026 research is based on 192 survey responses from professionals involved in content strategy, marketing, content creation, and performance measurement.
The survey examined:
- Meaningful engagement behaviors
- Reasons for measuring engagement
- Organic website traffic
- Overall engagement
- Content-driven leads and conversions
- Engagement metrics
- Attribution
- Production strategy
- AI adoption
- Audience and search intent
- Personalization
- Content formats
- Distribution
- Repurposing
- AI search
- First-party data
- Buyer-journey measurement
- Content outcomes
- Engagement challenges
- Future decision-making
An open-ended question asked respondents what had changed most about successful content in 2026.
Those responses repeatedly emphasized originality, firsthand expertise, trust, proprietary information, AI-search visibility, distribution, and stronger connections between content activity and business outcomes.
We’re grateful to all the research partners and contributors who shared their experience and perspectives for this study. [Meet our research partners →]
Research Partners Popup
Meet Our Research Partners